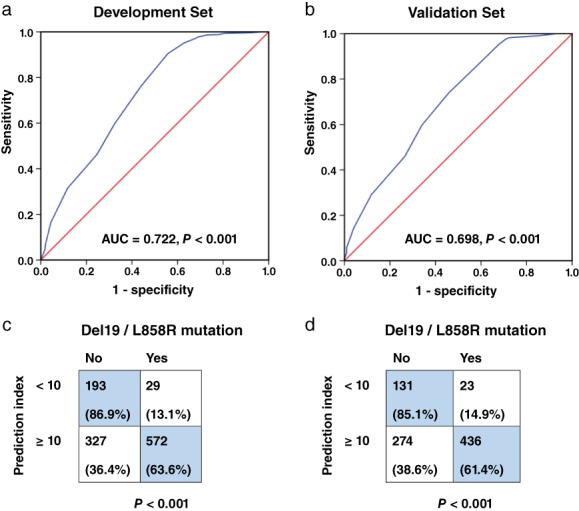
Figure 2.

Development and validation of the model. (a,b) Receiver operating characteristic curves of the prediction index (PI) in the development and the validation sets. The area under curves (AUCs) were 0.722 (P < 0.001) and 0.698 (P < 0.001), respectively. (c,d) The PI cutoff value was validated in both sets.
