Figure 1.

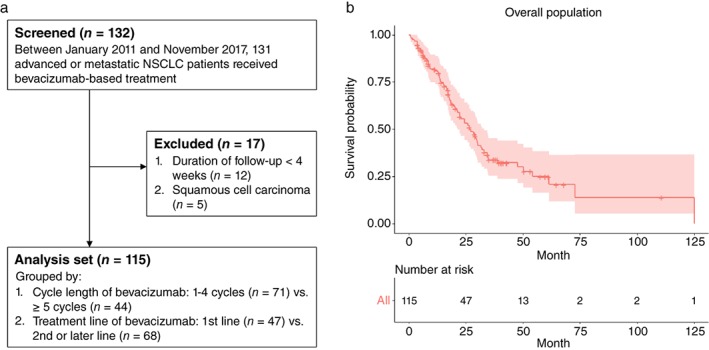
(a) Flow chart of the study population. (b) Kaplan–Meier curve with 95% confidence interval (red shade) of the overall survival of the study population. NSCLC, non‐small cell lung cancer.

(a) Flow chart of the study population. (b) Kaplan–Meier curve with 95% confidence interval (red shade) of the overall survival of the study population. NSCLC, non‐small cell lung cancer.