
Figure 9.
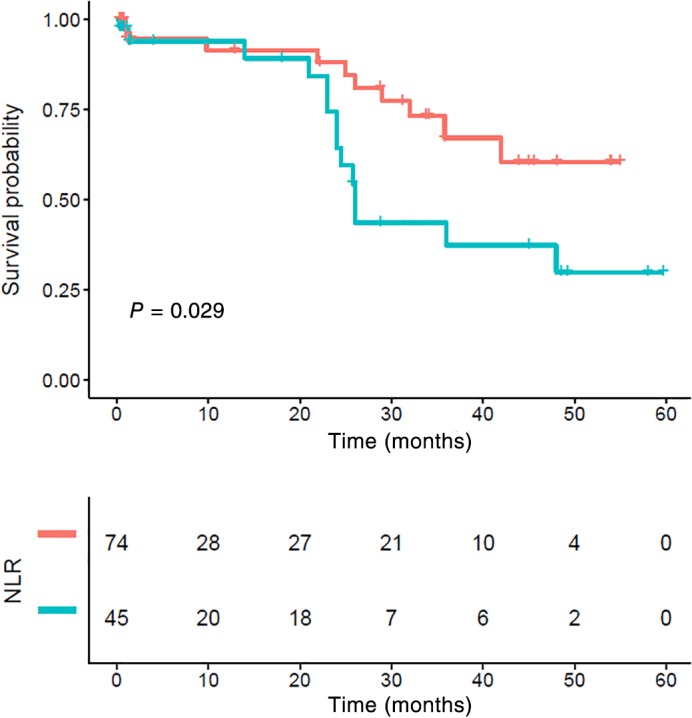
Kaplan–Meier survival curve and neutrophil‐to‐lymphocyte ratio (NLR) of stage III. Patients with high NLR had significantly poorer cancer‐specific survival compared to those with lower NLR (P < 0.001). NLR ( ) <low group and (
 ) ≥high group.