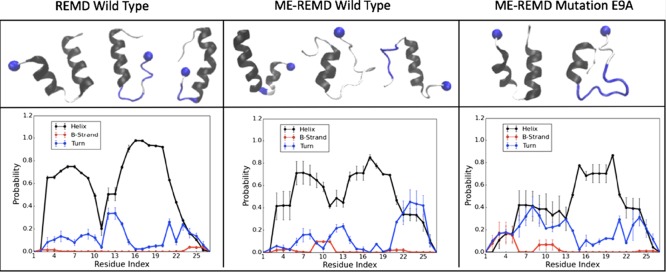
Figure 3.
Secondary structure frequency (lower row) and representative configurations for the dominant motifs (upper row) as found in REMD simulations with 36 replicas of the wild-type SAA (1–27) fragment (left panel), in ME-REMD simulations with 28 replicas of the wild-type SAA (1–27) fragment (middle panel), and in ME-REMD simulations with 28 replicas of the E9A mutant SAA (1–27) fragment (right panel). The frequency of α-helices is drawn in black, that of turns in blue, and of β-strands in red. The same color coding is used in the figures in the upper panel, with blue balls marking the N terminal of the segments.

