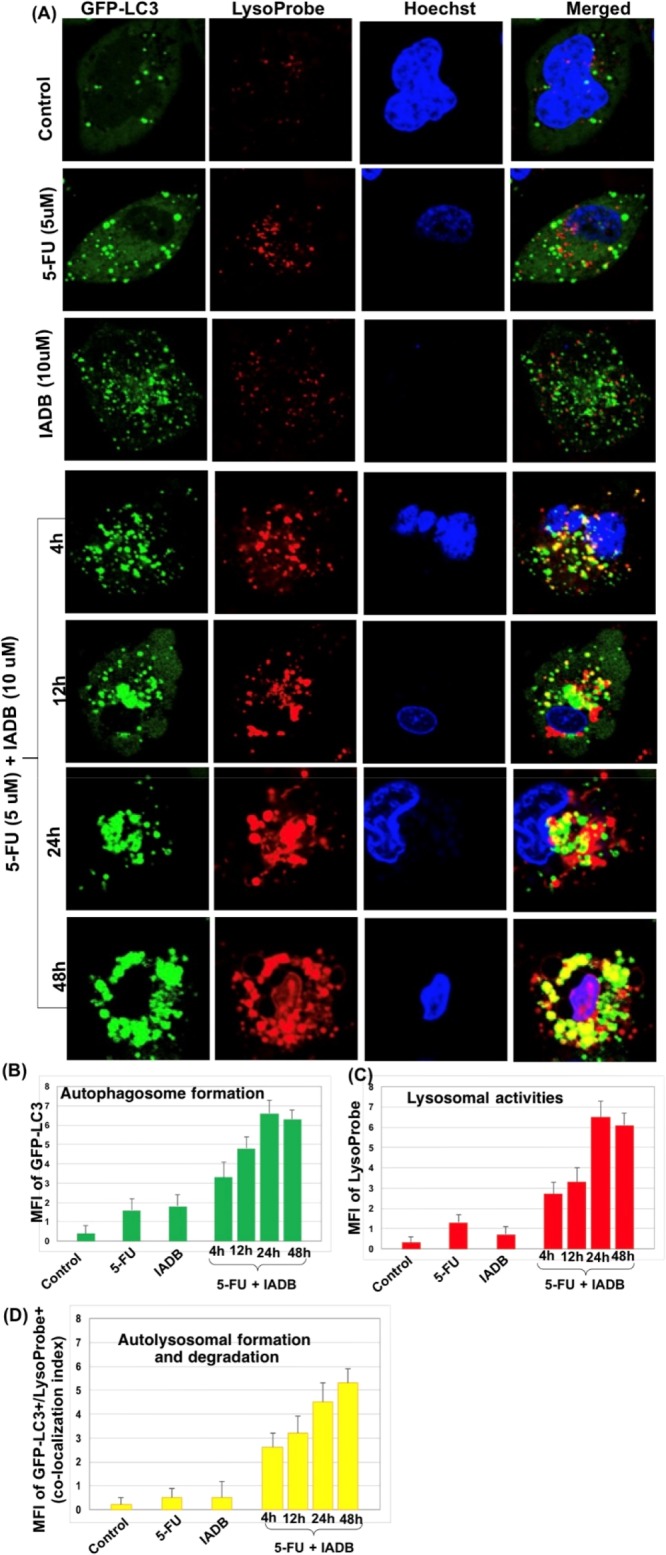
Figure 6.

Confirmation of “autophagic stress” induced by combined IADB + 5-FU treatment using confocal laser scanning microscopy. (A) Representative confocal fluorescence images of HT-29 cells subjected to different treatment protocols––counterstained with LysoProbe (red fluorescence), GFP-LC3 (green fluorescence) transfected cells, and Hoechst 33342 (blue fluorescence) (control cells (first row); 5-FU (5 μM) alone for 48 h (second row); pretreatment IADB (10 μM) for 12 h (third row); IADB-pretreated cells at 4 h (fourth row), 12 h (fifth row), 24 h (sixth row), and 48 h (seventh row) after exposure to 5-FU, respectively. (B) Total autophagosome number in HT-29 cells determined by measuring the MFI of GFP-LC3 changes. (C) Lysosomal activities evaluated in HT-29 cells by quantitation of MFI of LysoProbe changes. (D) Colocalization index determined as a measure of autolysosome formation (i.e., the fusion of autophagosome and lysosome) and degradation events (autophagic flux) by measuring the MFI of GFP-LC3+/LysoProbe+ double-positive HT-29 cells. N = 6 independent experiments.
