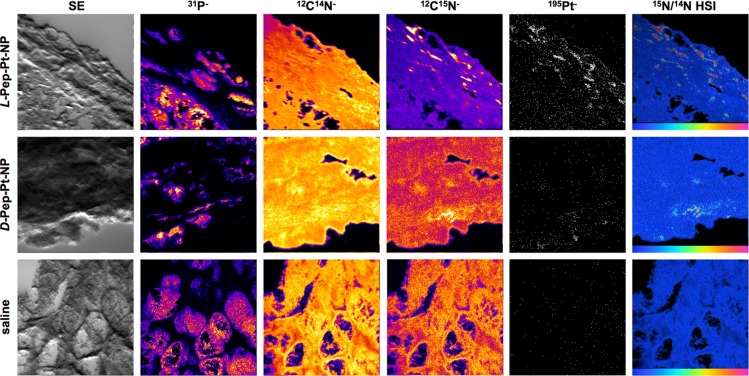
Figure 4.
NanoSIMS imaging of tissue slices. Secondary electron images (SE) and NanoSIMS ion maps of dehydrated 5 μm tumor tissue sections of mice treated with L-Pep-Pt-NP (top), D-Pep-Pt-NP (middle), or saline (bottom). 31P–, 12C14N–, 12C15N–, and 195Pt– ion maps were obtained simultaneously, and intensities are shown in a fire scale, except for the 195Pt– ion map which is shown in white/black. HSI images represent the 12C15N/12C14N ratio and highlight specifically enriched areas as can be seen for L-Pep-Pt-NP and D-Pep-Pt-NP samples. The scales on the HSI images were adjusted depending on the relative intensities for each sample. Thus, the scale for L-Pep-Pt-NP is 0.0037–0.02, for D-Pep-Pt-NP is 0.0037–0.11, and for the saline solution sample 0.0037–0.15. Images, in all cases, represent an area of 48 μm × 48 μm.

