Figure 4.
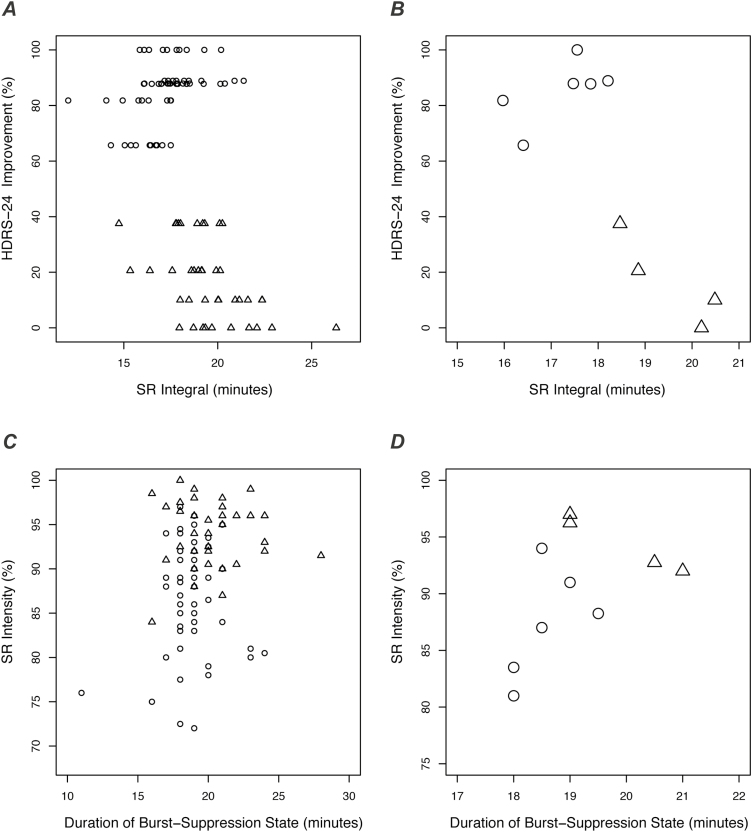
Electroencephalographic (EEG) suppression was associated with depression improvement. (A) Improvement in 24-item Hamilton Depression Rating Scale (HDRS-24) is plotted vs suppression ratio (SR) integral for responders (circles) and nonresponders (triangles). SR integral is an EEG measure representing the total time spent in the isoelectric state (explained in Figure 1). Each symbol represents a propofol treatment session. (B) Data from A are re-plotted to show subject-level measures (median values across treatment sessions). (C) As described in Figure 1, SR integral is dependent on both the “height” of the SR curve (SR intensity) and the “width” of the SR curve (duration of burst-suppression state). Here, SR intensity is plotted against duration of burst-suppression for each treatment session and each subject (circles, responders; triangles, nonresponders). (D) Data from C are re-plotted to show subject-level measures (median values across treatments). The treatments of subsequent responders were characterized by duration of burst-suppression <20 minutes and SR intensity <95%.

