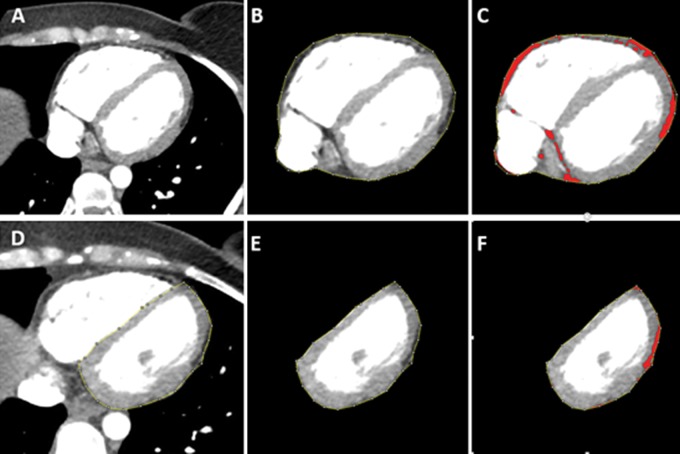
Figure 1:
Epicardial fat quantification with contrast-enhanced cardiac CT in 29-year-old woman with arrhythmogenic right ventricular dysplasia/cardiomyopathy. A, Axial image in midheart before performing analysis. B, Epicardial segmentation has been performed by tracing the pericardial contour. C, Threshold (−10 HU and lower limit of −190 HU) has been applied, highlighting all fat pixels in red. D, Example of left ventricular (LV) regional contouring to segment LV epicardial adipose tissue (EAT). E, Example of segmented LV EAT before fat thresholding. F, LV EAT after application of a fat threshold. The volume of fat (red pixels) is automatically calculated by the software. These steps were repeated for each epicardial fat region for each axial section through the heart.

