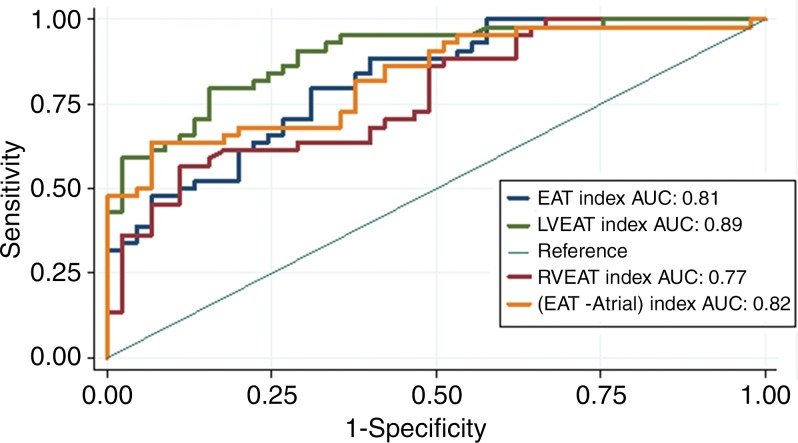
Figure 5:
Receiver operating curves for evaluating the ability of various epicardial fat parameters to enable the differentiation between patients with arrhythmogenic right ventricular dysplasia/cardiomyopathy (ARVD/C) and control group participants. Left ventricular (LV) epicardial adipose tissue index (EAT) has the greatest sensitivity and specificity for diagnosis of ARVD/C. AUC = area under the receiver operating characteristic curve, RV = right ventricle.

