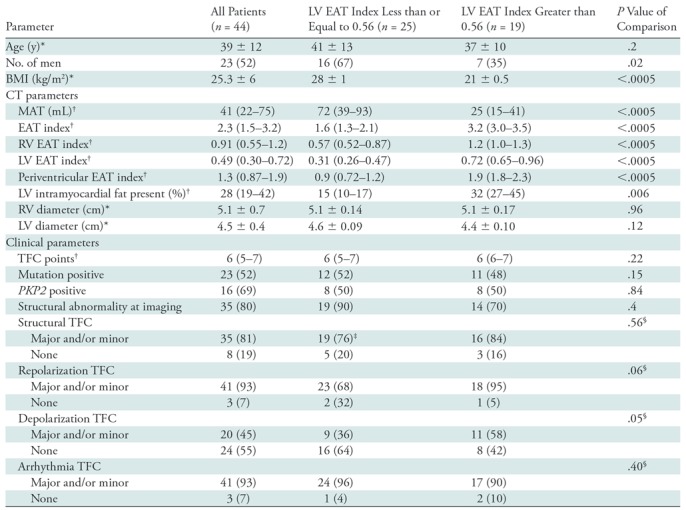
Table 3:
Comparison of Patients with ARVD/C Above and Below the Mean LV EAT Index

Note.—Except where indicated, data are numbers of patients, with percentages in parentheses. Periventricular EAT is the combination of LV and RV EAT, calculated by subtracting atrial EAT from EAT. ARVD/C = arrhythmogenic right ventricular dysplasia/cardiomyopathy, BMI = body mass index, EAT = epicardial adipose tissue, LV = left ventricle, MAT = mediastinal adipose tissue, RV = right ventricle, TFC = Task Force Criteria.
*Data are means ± standard deviations.
†Data are medians, with interquartile range in parentheses.
‡Structural Task Force Criteria information was not available for one patient.
§P value for Fisher exact test comparing proportion of patients meeting any criteria (major and/or minor criteria combined to single variable) for left ventricular epicardial adipose tissue volume groups above and below the mean.
