Fig. 2.
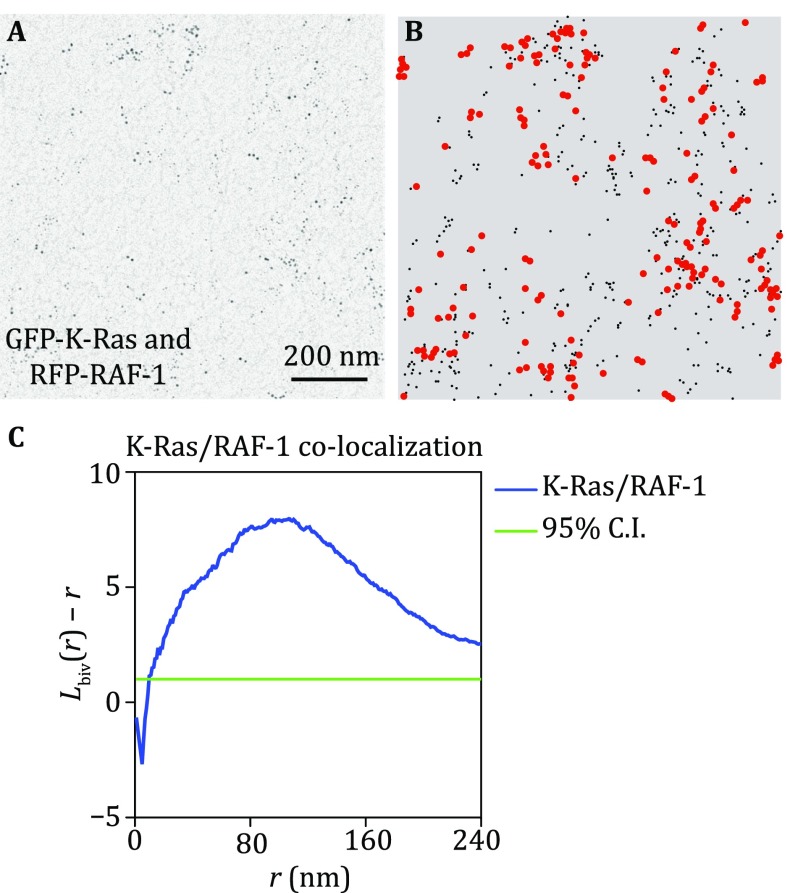
Bivariate co-clustering analysis characterizes the co-localization between two populations of gold nanoparticles. A An intact PM sheet of kidney cells ectopically co-expressing GFP-K-Ras and RFP-RAF-1 was attached to an EM grid, fixed and immunolabeled with 6-nm gold labeling GFP and 2-nm gold labeling RFP. Gold distribution on the intact PM sheet was imaged using transmission EM at 100,000× magnification. B x and y-coordinates of the gold particles were assigned using ImageJ and were used to calculate the co-localization between the two populations of gold. Smaller black dots indicate 2-nm gold labeling RFP; larger red dots indicate 6-nm gold labeling GFP. C The extent of co-localization, Lbiv(r) − r, was plotted against the length scale, r, in nanometer. Lbiv(r) − r values above the 95% confidence interval (95% CI) indicate statistically meaningful co-localization

