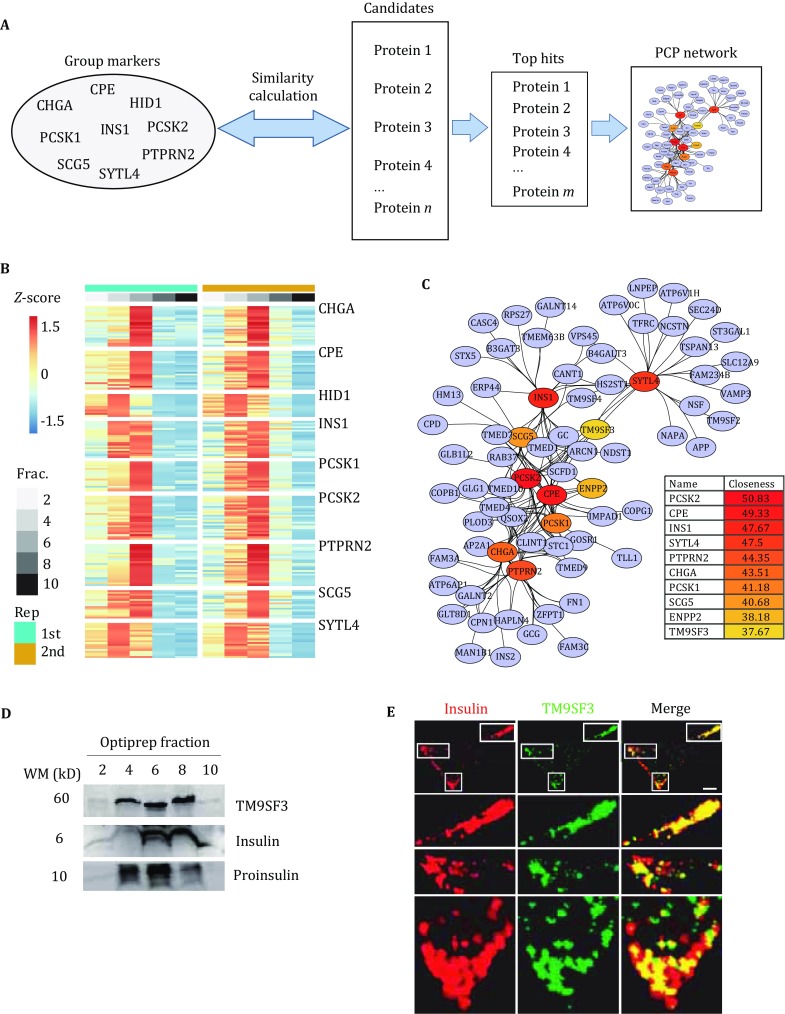
Fig. 4.

A Schematic to illustrate the PCP data analysis. B Heatmap of relative abundance of potential ISG proteins. Data were scaled by Z-transformation. C PCP network of potential ISG proteins. D Western blot analysis of TM9SF3, insulin and proinsulin in OptiPrep fractions. E Immunofluorescence micrographs showed the co-localization of TM9SF3 (green) and insulin (red) in INS-1 cells. Anti-insulin was diluted 1:400, and anti-TM9SF3 was diluted 1:100. Scale bar: 5 μm
