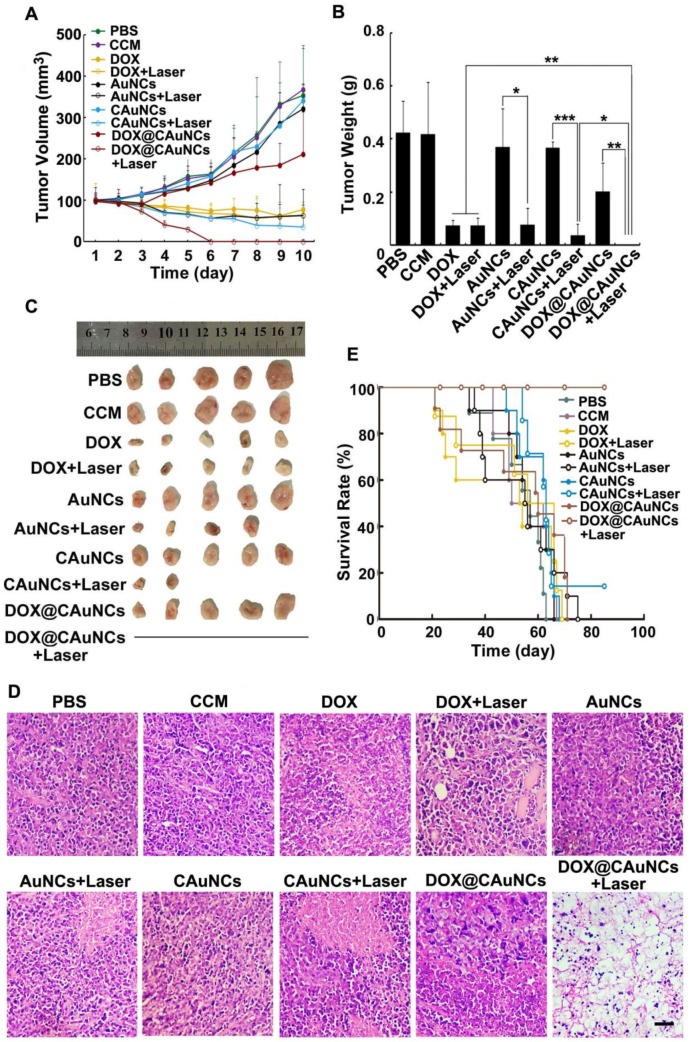
Figure 6.
In vivo synergistic PTT-chemotherapy of DOX@CAuNCs. (A) Tumor growth curves of H22 tumor-bearing mice after intravenous injection with different formulations at the corresponding Au and DOX dose of 10 and 15 mg/kg, followed with or without 808 nm laser irradiation (1 W/cm2) for 10 min once a day for four consecutive days at the tumor tissues. Data as mean value±SD (n=13). (B) Tumor weight after treatment. Data as mean value ± SD (n=5). *P<0.05, **P<0.01. ***P<0.001. (C) Photos of tumors after treatment. (D) H&E staining of tumors after H22 tumor-bearing mice were intravenously injected with different formulations at the corresponding Au and DOX dose of 10 and 15 mg/kg, followed with or without 808 nm laser irradiation (1 W/cm2) for 10 min once a day for three consecutive days at the tumor tissues. Scale bar: 50 µm. (E) Kaplan-Meier survival plot of H22 tumor-bearing mice after intravenous injection with different formulations at the corresponding Au and DOX dose of 10 and 15 mg/kg, followed with or without 808 nm laser irradiation (1 W/cm2) for 10 min once a day for four consecutive days at the tumor tissues (n=8).

