Figure 5.
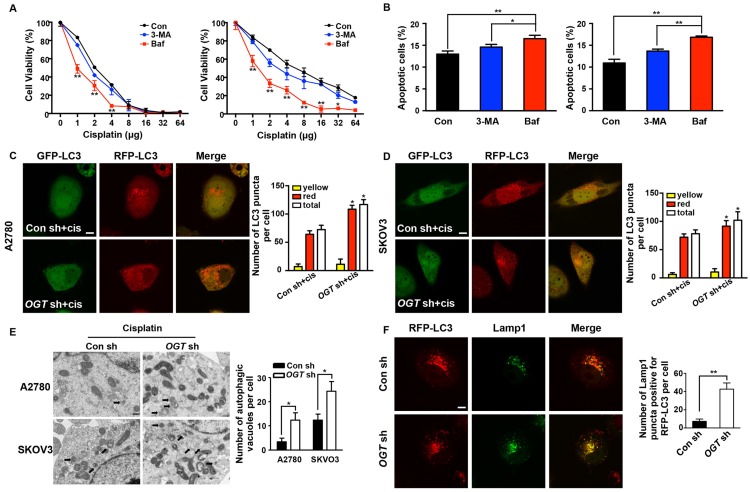
Down-regulation of OGT promotes the formation of autolysosome induced by cisplatin. (A) OGT-deficient A2780 and SKOV3 cells were cultured in different concentrations of cisplatin with 3-MA (3 mM) or Baf (200 nM) for 48 h. Cell viability was measured by CCK-8. (B) OGT-deficient A2780 and SKOV3 cells were treated with 3-MA (3 mM) or Baf (200 nM) in the presence of cisplatin (5 µg/mL) for 24 h. Apoptotic cells were identified by ANXA5 and PI staining. (C-D) Control and OGT-deficient A2780 (C) and SKOV3 (D) cells were transfected with mRFP-GFP-LC3 vector for 24 h and then treated with cisplatin (5 µg/mL) for 24 h. Representative images of fluorescent LC3 puncta are shown. The mean number of yellow puncta representing autophagosomes and the mean number of red puncta representing autolysosomes are plotted. *P < 0.05 compared with Con sh+cis group. Scale bar represent 10 μm. (E) Control and OGT-deficient A2780 and SKOV3 cells were treated with cisplatin for 24 h and then analyzed by transmission electron microscopy. Scale bars represent 500 nm. (F) OGT-deficient SKOV3 cells were transfected with RFP-LC3 plasmids and then treated with cisplatin (5 µg/mL) for 24 h. Lamp1 puncta were detected by anti-Lamp1. Scale bar represent 10 μm. The values are presented as mean ± SD (n = 3). **P < 0.01, *P < 0.05.

