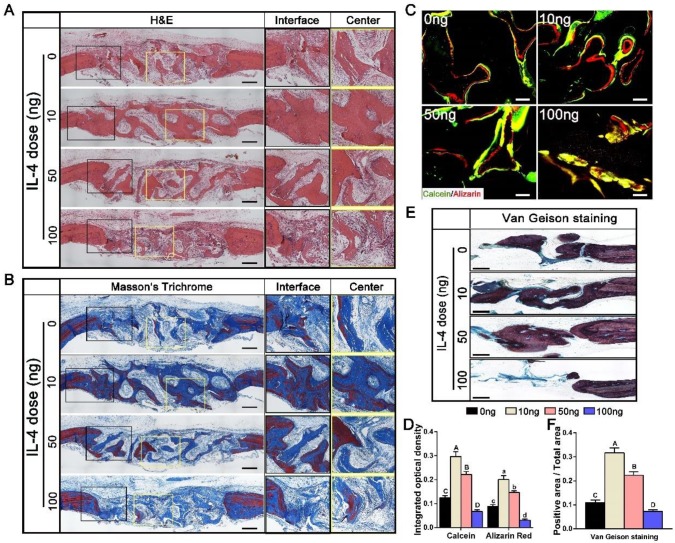
Figure 3.
Histological evaluation of DBM regenerated bone tissue at 12 weeks after accurate and proactive immunomodulation via four different doses of IL-4 (0 ng, 10 ng, 50 ng and 100 ng). (A) H&E and (B) Masson's trichrome staining further confirmed the micro-CT findings that the 0 ng group exhibited a bone tissue in-growth pattern from peripheral region, while the 10 ng and 50 ng groups showed a bone tissue in-growth pattern from the peripheral region and an in-situ bone island formation pattern in the central region. However, the 100 ng group exhibited non-union healing, and the defects were filled with loose connective fibrous tissues surrounding the minimal new bone formation. Bar = 500 μm. (C) Fluorescent images of newly formed bone double-labeled with calcein (green) and alizarin red (red). Bar = 100 μm. (D) Summary of fluorescence labeling. (E) Van Gieson staining for new bone formation (red particles). Bar = 500 μm. (F) Summary of Van Gieson staining results. For all charts, the groups designated by different uppercase letters or lowercase letters were significantly different (p < 0.05).

