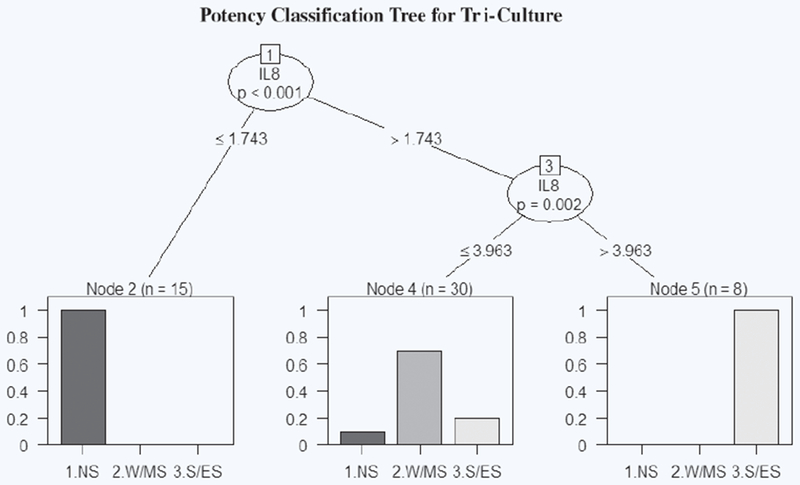
Figure 4.

IL-8 potency classification tree generated in R for tri-culture. The first node splits at SI = 1.743 and classifies the chemical based on SI value as non-sensitizer (SI ≤ 1.743) or sensitizer (SI > 1.743). The second node splits at SI = 3.963 and classifies sensitizers based on SI value as W/M (SI ≤ 3.963) or S/E (SI > 3.963). Each bar graph represents the percentage breakdown of chemicals classified in each category by their known classification. “n” represents chemical concentrations grouped in each leaf.
