
Figure 4.
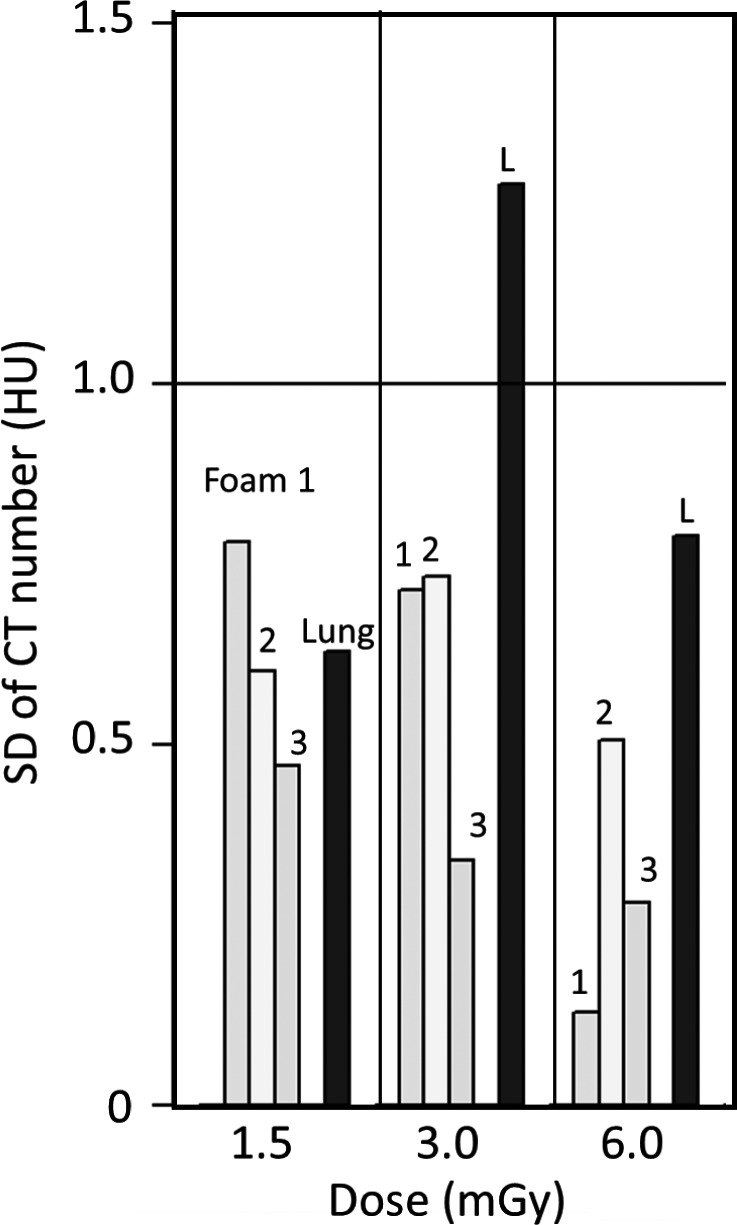
CT number variation by dose levels for each foam, labeled as Foam 1, 2, 3, and Lung (L), for calibrated CT number at 80 keV. The number of data points for each of the dose levels (1.5 mGy, 3 mGy, and 6 mGy) is 5, 9, and 8 respectively. The expected reduction in the SD due to increased dose rate is observed for foams 1 and 3. With the exception of the lung foam at 3 mGy, all the SD's are below 1 HU. The high value for the lung foam at 3 mGy is mostly due to a single scanner, as indicated in the 4th panel of Fig. 3.