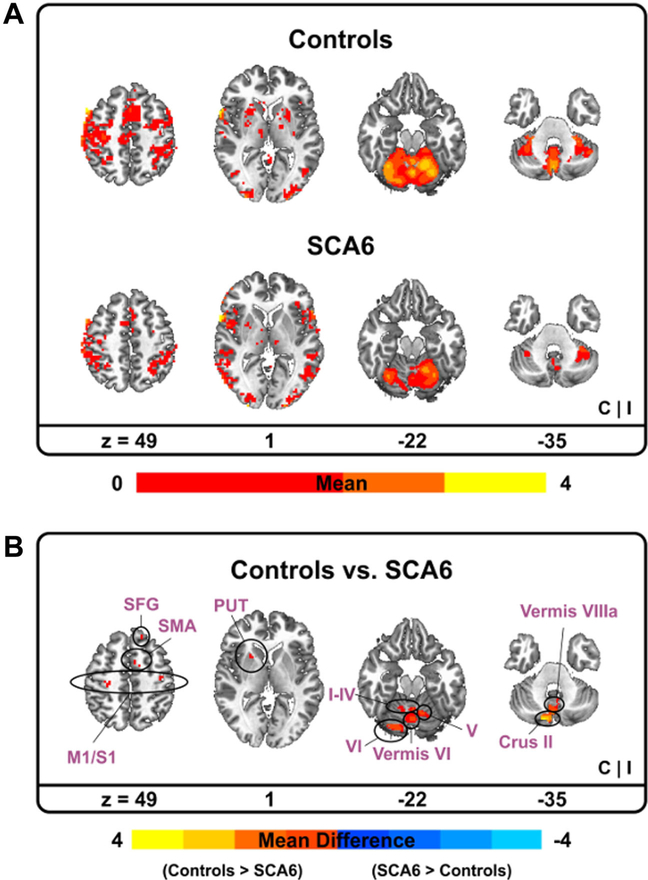
Fig. 2.
Functional MRI results between SCA6 and controls. Functional activity for each group. Warm (yellow) colors indicate where BOLD (blood oxygen level-dependent) activity was positive (a). Functional activity difference between two groups. Warm (yellow) colors indicate where BOLD activity in controls was greater than SCA6 whereas cold (blue) colors denote where BOLD activity in controls was less than SCA6 (b). C contralateral hemisphere, I ipsilateral hemisphere, M1 primary motor cortex, PUT putamen, S1 primary somatosensory cortex, SFG superior frontal gyrus, SMA supplementary motor area

