Fig. 3.
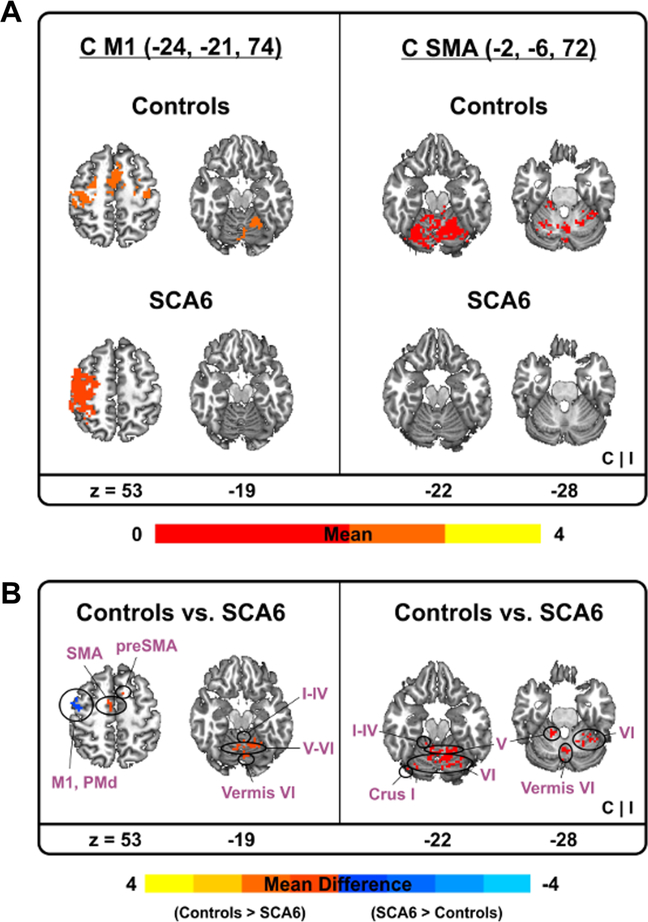
Task-based functional connectivity results between SCA6 and controls. Task-based functional connectivity between contralateral M1 vs. cerebellum (left) and contralateral SMA vs. cerebellum (right). Warm (yellow) colors indicate where task-based functional connectivity was positive (a). Task-based functional connectivity difference between two groups. Warm (yellow) colors indicate where task-based functional connectivity in controls was greater than SCA6 whereas cold (blue) colors denote where task-based functional connectivity in controls was less than SCA6 (b). C contralateral hemisphere, I ipsilateral hemisphere

