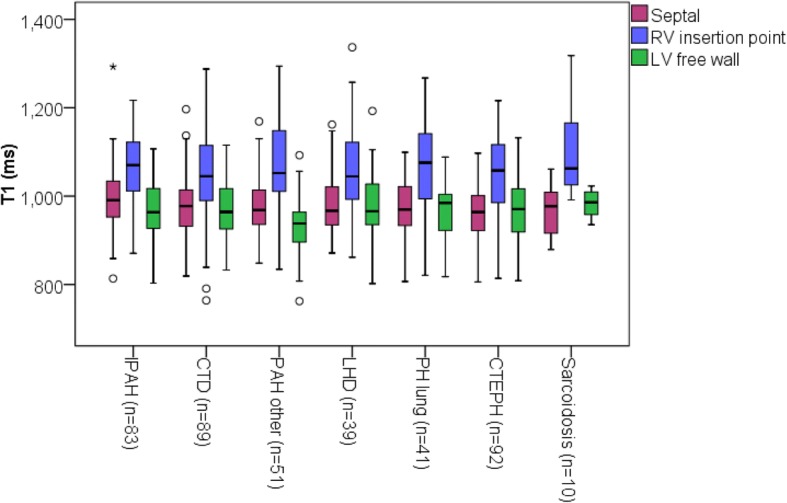
Fig. 4.

Mean T1 in subgroups of patients with pulmonary hypertension. Box plot of mean T1 for septal, RV insertion point and LV free wall regions for pulmonary artery hypertension patient subtypes. PAH other includes all patients with PAH who do not have IPAH,CTD or CHD. O Represents outliers * represents far outliers
