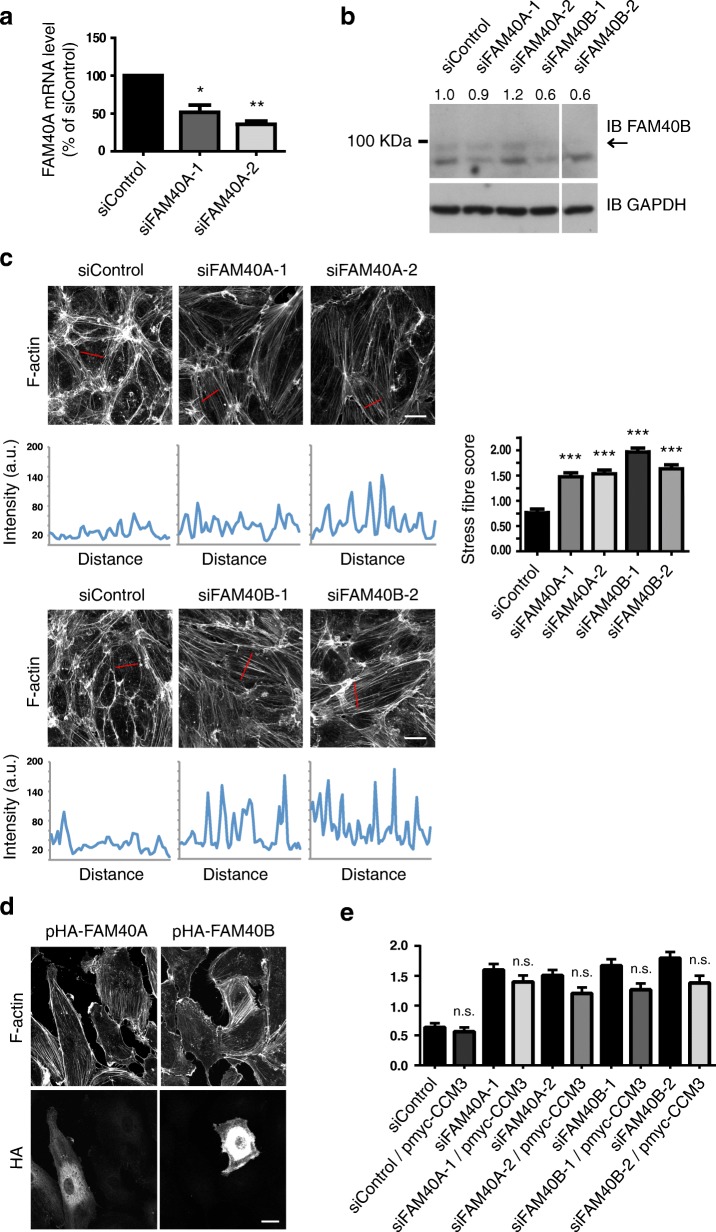
Fig. 3.
FAM40A and FAM40B regulate stress fibers in endothelial cells. HUVECs were transfected with siRNAs targeting FAM40A, FAM40B or with a control siRNA, and analysed 72 after transfection. a The amount of FAM40A mRNA was determined by quantitative PCR. Data are normalised to GAPDH mRNA levels and are the mean ± SEM; n = 3. b Representative immunoblot of HUVEC lysates. Whole cell lysates were immunoblotted for FAM40B and GAPDH as a loading control; arrow indicates FAM40B protein. Lanes are from the same immunoblot. Quantification of FAM40B band intensities (to band) is shown above the blot, relative to siControl, and was carried out using ImageJ. c Cells were seeded onto fibronectin-coated glass coverslips to form confluent monolayers. Cells were fixed and stained for F-actin. Images are compressed stacks of 10–15 z-sections. Scale bar, 40 μm. Intensity profiles are indicated for representative cells with the region scanned indicated as a red line on each image. Graph (right panel) shows quantification of stress fibers from at least 150 cells per condition from 3 independent experiments ± SEM. d HUVECs were transfected with pHA-FAM40A, pHA-FAM40B or pmyc-CCM3, seeded onto fibronectin-coated glass coverslips and fixed after 24 h. Cells were stained for F-actin and the HA or myc epitope. Images are compressed stacks of 15–20 z-sections (FAM40A/B) or single images (CCM3) and are representative of 2 independent experiments. Scale bar, 20 μm. e HUVECs were transfected with control siRNA or siRNAs targeting FAM40A or FAM40B, followed after 48 h by transfection with pmyc-CCM3. After a further 24 h, stress fibers were quantified from at least 100 cells per condition from 2 independent experiments. *p < 0.05, **p < 0.01, ***p < 0.001, n.s. not significant; Student’s t-test, compared to siControl

