Fig. 5.
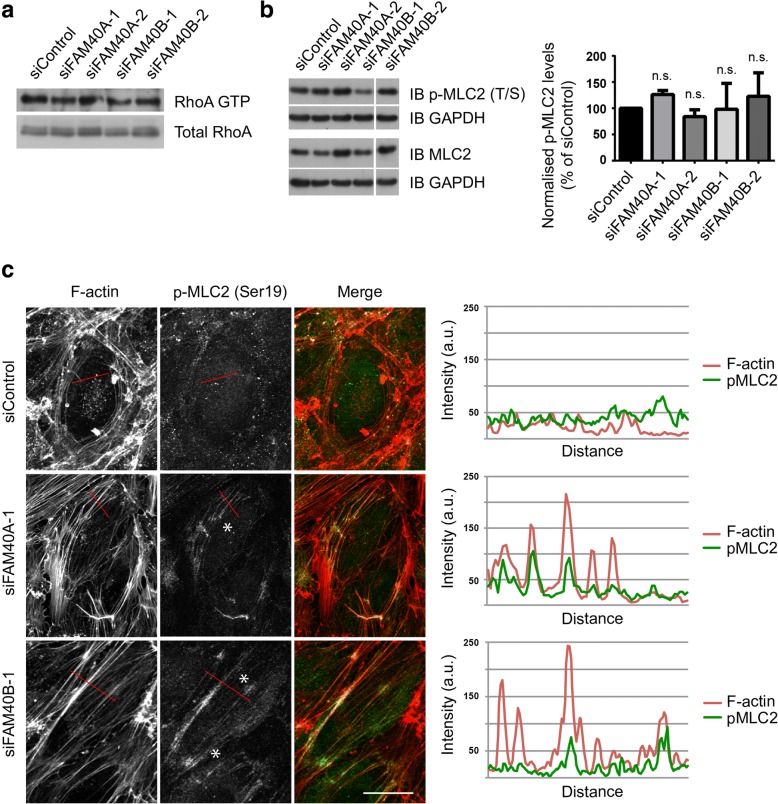
Effects of FAM40A or FAM40B on RhoA activity and MLC2 phosphorylation. a HUVECs were transfected with siRNAs targeting FAM40A or FAM40B. After 72 h, cells were lysed and whole cell lysates used in a GST-RBD pulldown assay to determine levels of active GTP-loaded RhoA. A representative immunoblot for total and GTP-loaded RhoA is shown (n = 3). b Immunoblot of phospho-MLC2 (pMLC2) and MLC2 in FAM40A and FAM40B-depleted HUVECs. Quantification of pMLC2 levels was performed by individually normalising pMLC2 and MLC2 levels to GAPDH levels. The ratio of the normalised pMLC2 level to the normalised MLC2 level was used as a measure of MLC2 phosphorylation. Data are means of 3 independent experiments ± SEM. n.s. not significant; Student’s t-test compared to siControl. c HUVECs were transfected with siRNAs targeting FAM40A or FAM40B and seeded onto fibronectin-coated glass coverslips to form confluent monolayers. 72 h after transfection cells were fixed and stained for F-actin and pMLC2. Images are compressed stacks of 10–15 z-sections. Asterisks indicate examples of regions where pMLC2 co-localizes with stress fibers. Images shown are compressed stacks of 10–15 z-sections and are representative of 2 independent experiments. Scale bar, 20 μm. Dual colour intensity profiles for F-actin and pMLC2 are indicated for representative cells with the region scanned indicated as a red line on each image

