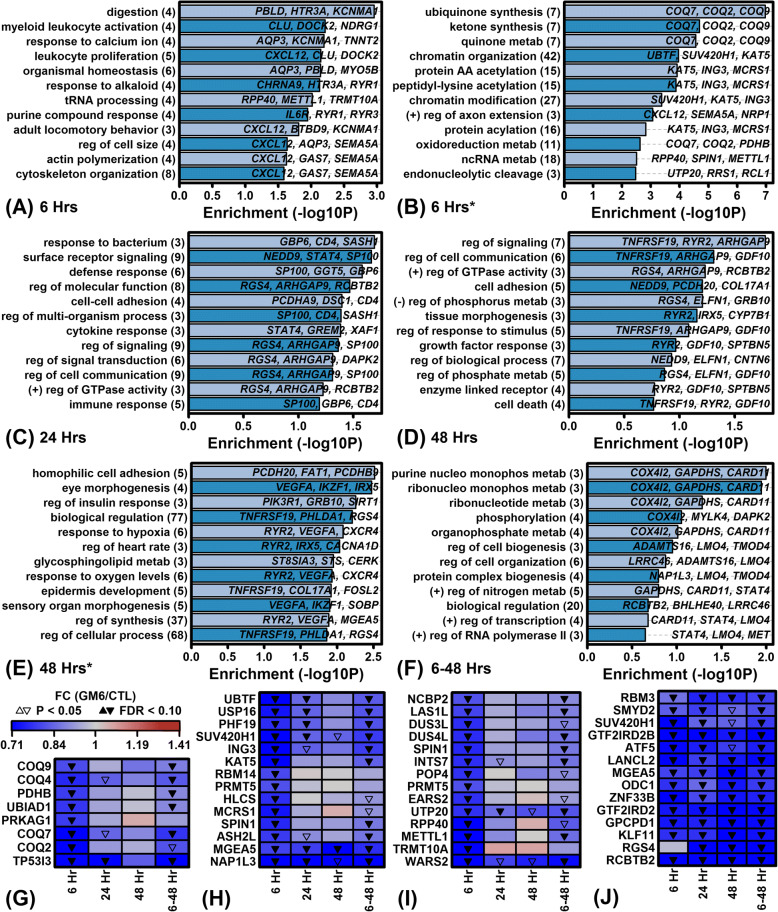
Fig. 4.
Gene Ontology (GO) biological process (BP) terms associated with GM6-decreased genes. (a – f) Top-ranked GO BP terms. Figures list GO BP terms most strongly enriched with respect to the GM6-decreased DEGs identified at (a, b) 6 h, (c) 24 h, (d, E) 48 h and (f) 6–48 h. The analyzed DEGs were significant at the threshold of (a, c, d, f) FDR < 0.10 and FC < 0.67 or the less stringent threshold of (b, e) FDR < 0.10 and FC < 1.00 (*). The number of GM6-decreased genes associated with each GO BP term is listed in parentheses (left margin) and exemplar genes for each term are listed in each figure. Statistical significance of enrichment (horizontal axis) was evaluated using a hypergeometric test. Labels associated with some GO BP terms are abbreviated. (g – j) Heatmaps show GM6-decreased genes associated with (g) oxidoreduction coenzyme metabolic process (GO:0006733), (h) chromatin organization (GO:0006325), (i) ncRNA metabolic process (GO:0034660) and (j) biological regulation (GO:0065007). Genes shown for each GO BP term were most strongly decreased by GM6 at 6 h

