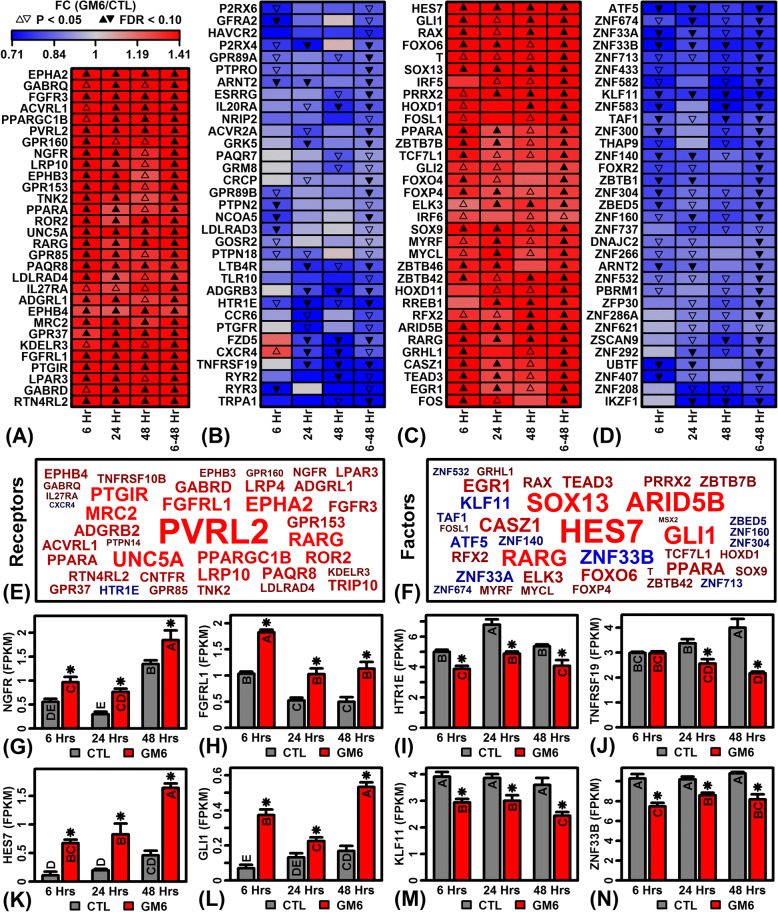
Fig. 5.
GM6-regulated genes encoding receptors and TFs. (a) Receptor-encoding genes most consistently up-regulated by GM6 across the 3 time points (6–48 h). (b) Receptor-encoding genes most consistently down-regulated by GM6 across the 3 time points (6–48 h). (c) TF-encoding genes most consistently up-regulated by GM6 across the 3 time points (6–48 h). (d) TF-encoding genes most consistently down-regulated by GM6 across the 3 time points (6–48 h). (e, f) Gene symbol clouds for genes encoding (e) receptors and (f) transcription factors. The size of each symbol corresponds to the significance of p-values across the three time points (6, 24 and 48 h; red = GM6-increased; blue = GM6-decreased). (g) Nerve growth factor receptor (NGFR) expression. (h) Fibroblast growth factor receptor like 1 (FGFRL1) expression. (i) 5-hydroxytryptamine receptor 1E (HTR1E) expression. (j) TNF receptor superfamily member 19 (TNFRSF19) expression. (k) Hes family bHLH transcription factor 7 (HES7) expression. (L) GLI family zinc finger 1 (GLI1) expression. (m) Kruppel like factor 11 (KLF11) expression. (n) Zinc finger protein 33B (ZNF33B) expression. In (g) – (n), letters shown for each bar indicate results from post hoc treatment comparisons (Fisher’s least significant difference), where treatments not sharing the same letter differ significantly (P < 0.05)

