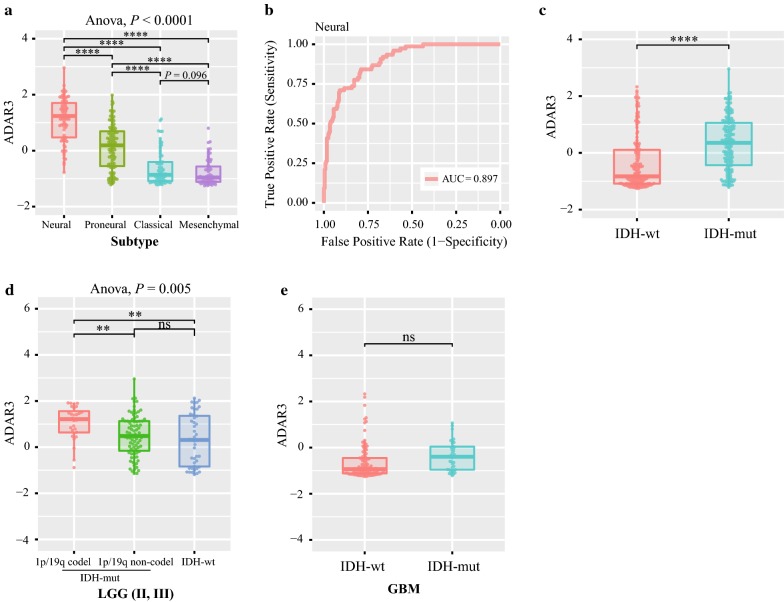
Fig. 2.
ADAR3 expression in stratified patients based on CGGA dataset. a ADAR3 expression among different subtypes of patients. b The receiver operator characteristic (ROC) curve to predict the neural subtype according to ADAR3 expression. c ADAR3 expression between IDH-wt and IDH-mut patients. d ADAR3 expression between LGG IDH-mut and IDH-wt patients. e ADAR3 expression between GBM IDH-wt and IDH-mut patients. ****P < 0.0001; **P < 0.01; ns, indicates no significant

