Fig. 3.
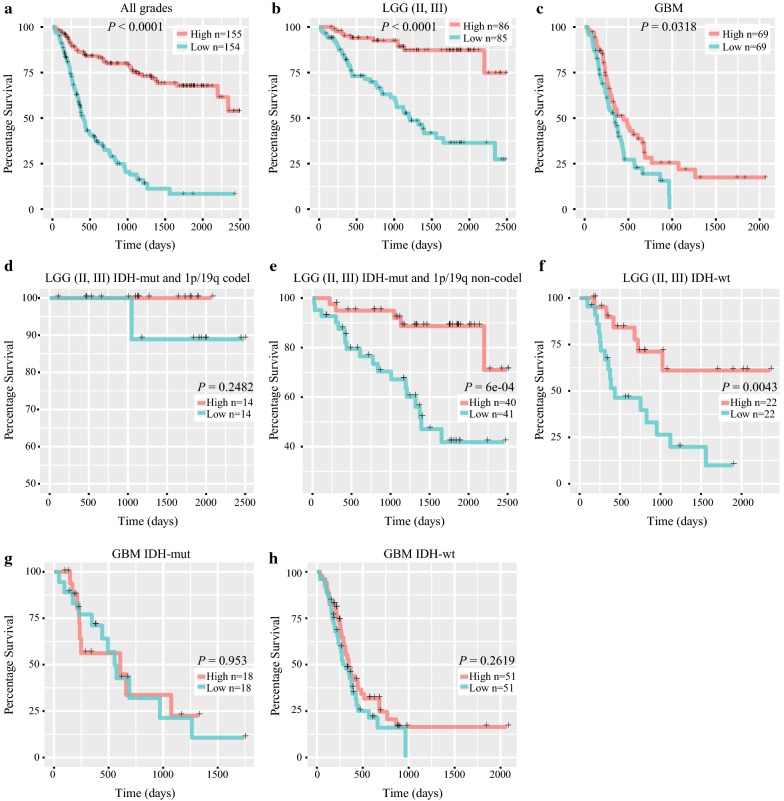
Survival analysis in patients stratified by grade, IDH and 1p/19q status based on ADAR3 expression in CGGA RNAseq dataset. a–c Comparison of the OS between high and low ADAR3 expression group in all grades, LGG and GBM patients. d–f Kaplan–Meier analysis of ADAR3 expression in LGG stratified by IDH and 1p/19q status. g, h Kaplan–Meier analysis of ADAR3 expression in GBM IDH-mut and IDH-wt patients. OS, overall survival; LGG, lower-grade glioma; GBM, glioblastoma

