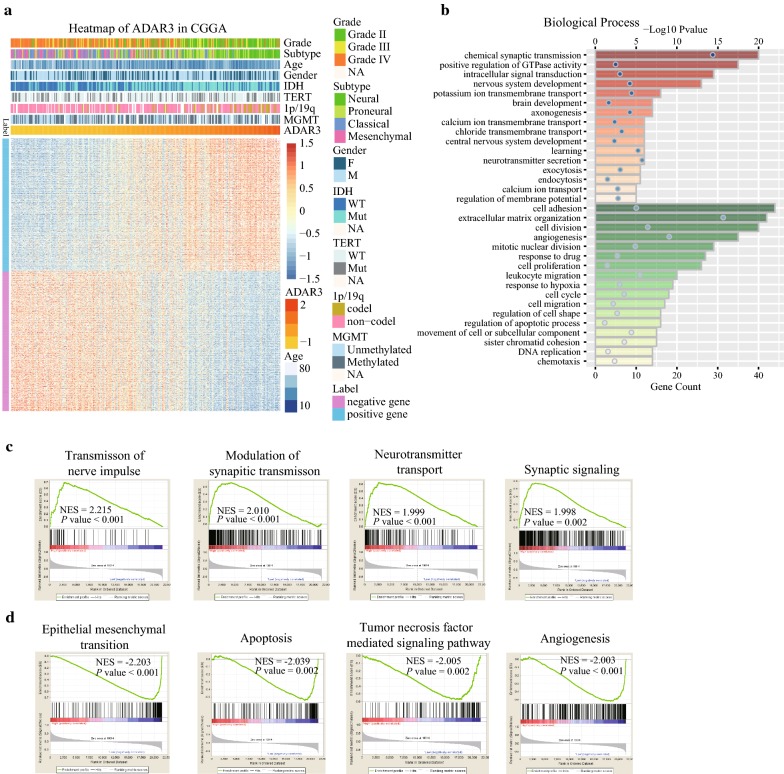
Fig. 4.
Functional annotation of ADAR3 in CGGA RNAseq data. a Heatmap of ADAR3 in CGGA RNAseq data. b Gene ontology analysis of the biological processes for ADAR3 by DAVID. Orange columns, ADAR3 positive related genes involved biological process; Green columns, ADAR3 negative related genes involved biological process. c GO terms enriched in high ADAR3 expression group of glioma patients analyzed by GSEA. d GO terms enriched in low ADAR3 expression group of glioma patients analyzed by GSEA. NES, normalized enrichment score

