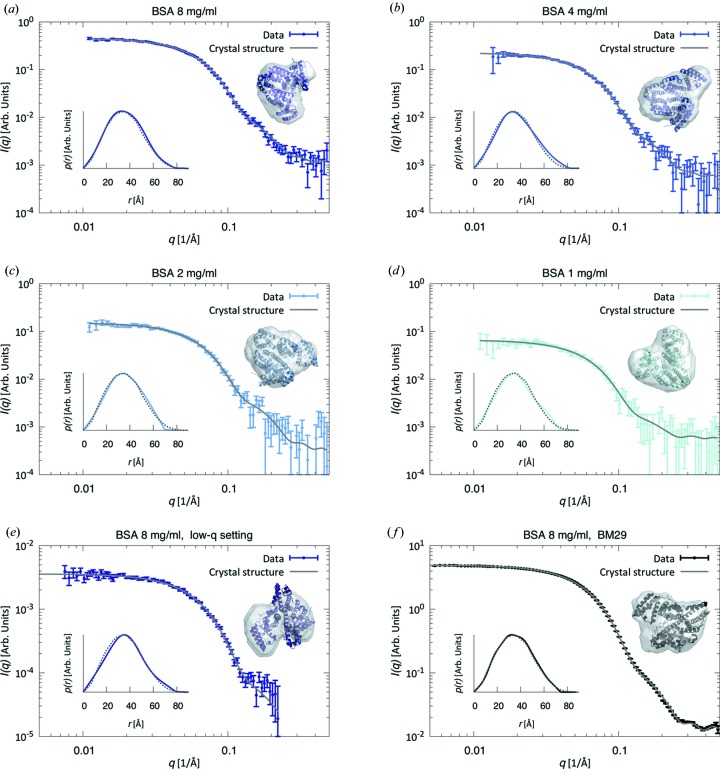
Figure 2.
(a)–(e) BSA monomer data from SEC-SAXS (data points) at different concentrations and detector settings [(a)–(d) d = 654 mm, q = (0.011–0.50) Å−1; (e) d = 1507 mm, q = (0.0075–0.22) Å−1], together with the theoretical scattering curves calculated from the known crystal structure of monomeric BSA (gray lines). Insets show ab initio models based on the experimental data together with the crystal structure of BSA, viewed from different angles, as well as the corresponding pair-distance distribution functions, p(r) [solid lines: experimental data; dotted lines: calculated p(r)]. (f) SEC-SAXS BSA monomer data set from a synchrotron BioSAXS beamline (BM29, ESRF, Grenoble).

