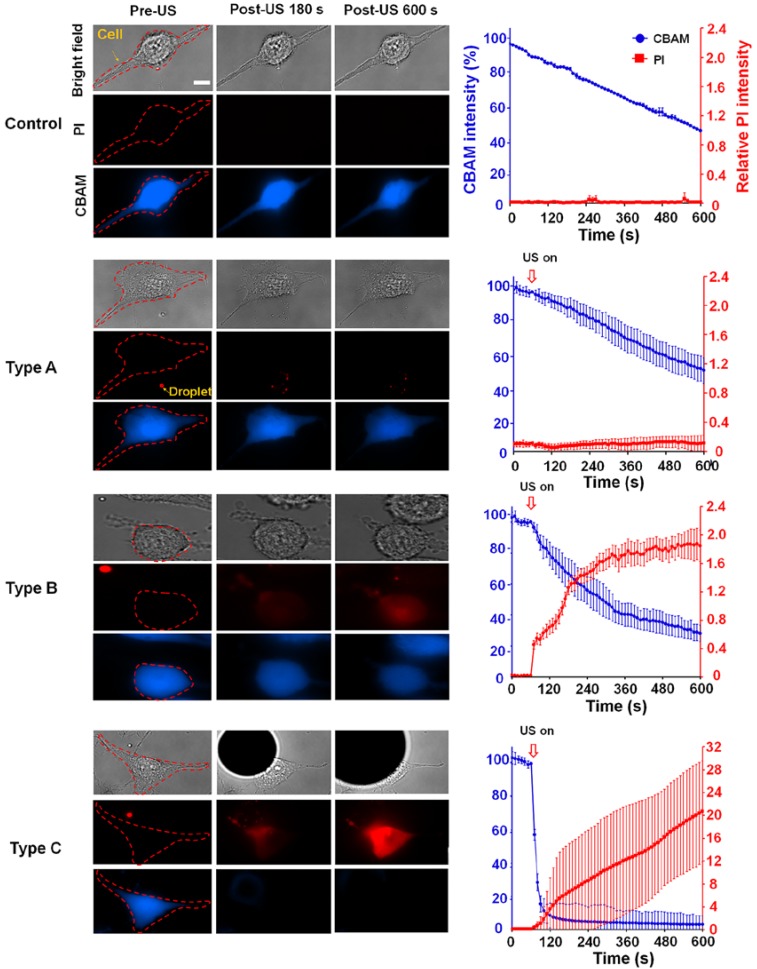
Figure 2.
The observed ADV-induced bio-effects on adjacent cells (N=266). Left: different types of cells were identified by bright-field and fluorescence (PI and CBAM) images pre- and post-US; right: time trace of intracellular PI uptake level and CBAM fluorescence intensity from 0 s (the beginning of US exposure) to 600 s, with 15-s intervals. Scale bar: 10 μm. Data are presented as mean ± SD.

