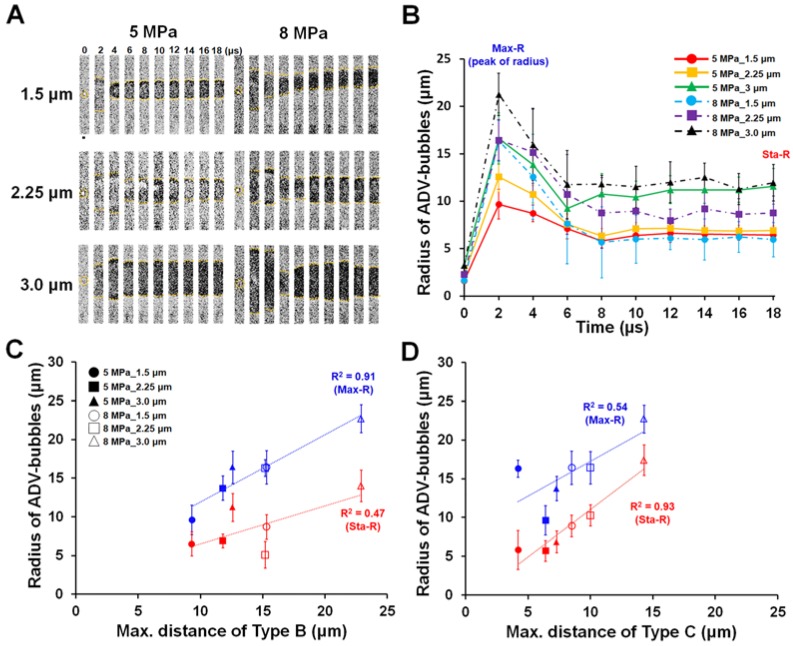
Figure 4.
The radius change of droplets during ADV. (A) High-speed microscopic images (500 kfps) acquired during droplet vaporization with different parameters. (B) Radius-time change curve during droplet vaporization (N=10 in each condition). The relation between radius of ADV-bubbles and maximum distance of type B (C), and type C (D) effects. Scale bar: 5 μm. Data are presented as mean ± SD.

