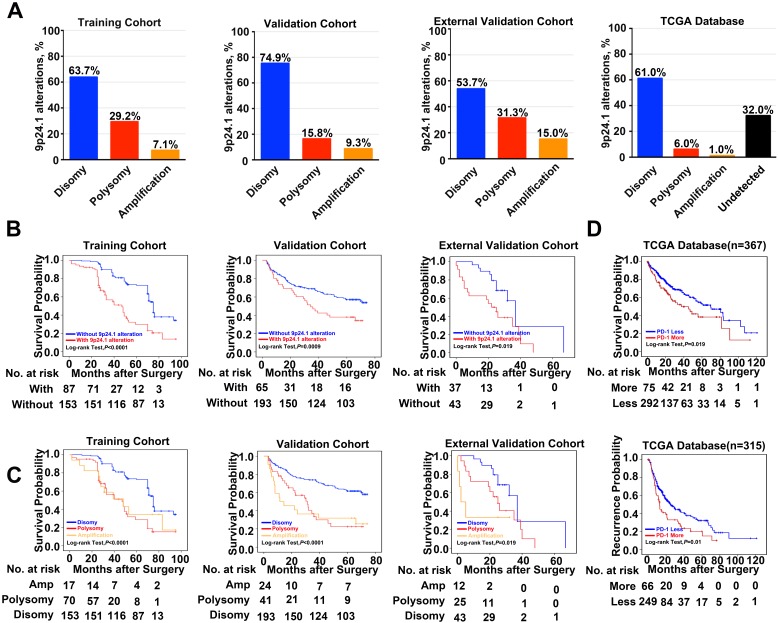
Figure 2.
Frequency and prognostic significance of the 9p24.1 alterations in HCC. (A) 9p24.1 alterations evaluated in training, validation, external validation cohorts and TCGA database. HCC are classified by the highest observed level of 9p24.1 alteration in tumor cells: disomy (blue), polysomy (red), amplification (gold) and undetected (black). Percentages of patients with 9p24.1 disomy, polysomy, amplification were summarized. (B) Kaplan-Meier curves showing dismal survival in patients with (red) 9p24.1 alterations than those without (blue) in three independent cohorts. (C) Kaplan-Meier curves showing poorest survival in patients with 9p24.1 amplification (gold) than those with polysomy (red) or disomy (blue) in three independent cohorts. (D) Kaplan-Meier curves showing significant unfavorable survival (n = 367) and increased recurrence (n = 315) in patients with more PD-1 copy number (red) than those with less PD-1 copy number (blue) in TCGA database.

