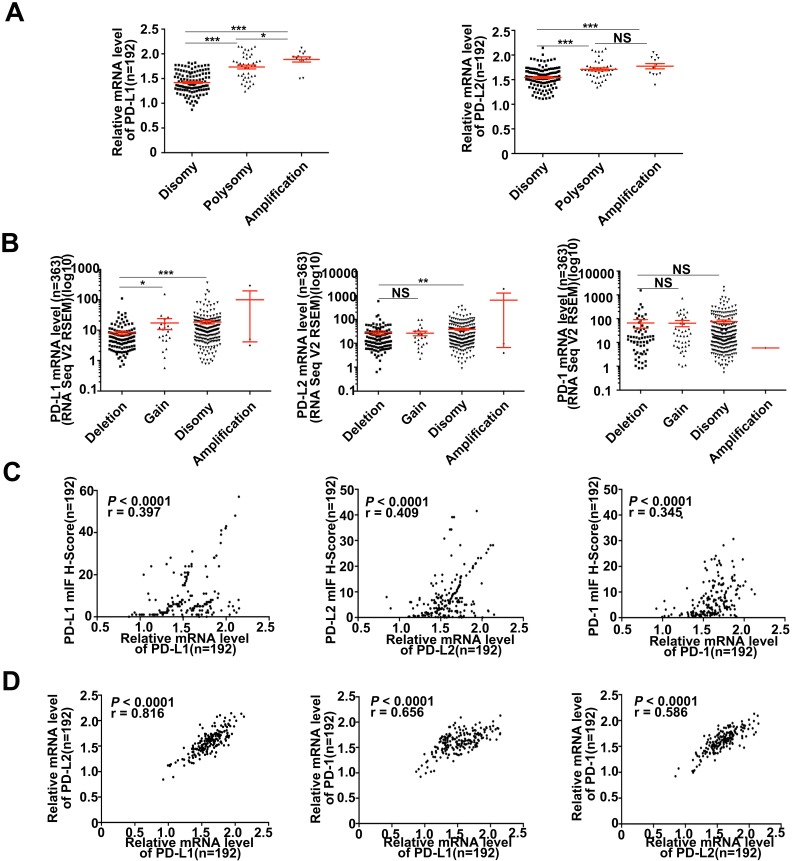
Figure 3.
Descriptive and correlational analyses of transcriptional/translational level of PD-L1/PD-L2 and 9p24.1 copy number alterations in HCC patients. (A) The distribution of transcriptional level in each group of the 9p24.1 copy number alterations (n = 192). The y-axis shows relative mRNA level of PD-Ls; the x-axis indicates status of 9p24.1 alterations. A statistically significant increase in relative mRNA level was found in the 9p24.1 amplification subgroups than those in polysomy or disomy. (B) The distribution features of transcriptional level in each group of the PD-L1/PD-L2/PD-1 copy number alterations are validated by RNA seq data from TCGA database (n = 363). The y-axis shows mIF H-score; the x-axis indicates status of 9p24.1 alterations. Data were presented as means ± SEM. *P < 0.05, **P < 0.01, and ***P < 0.001; two-tailed Student's t test. (C) Correlation analysis of PD-L1/PD-L2/PD-1 translational levels and corresponding transcriptional levels in training cohort (n = 192). Significant positive correlations are found between the mIF H-score and relative mRNA level in PD-L1/PD-L2/PD-1. (D) Significant positive correlations are uncovered between PD-Ls and PD-1 in mRNA levels in training cohort (n = 192). Pearson correlation analysis.

