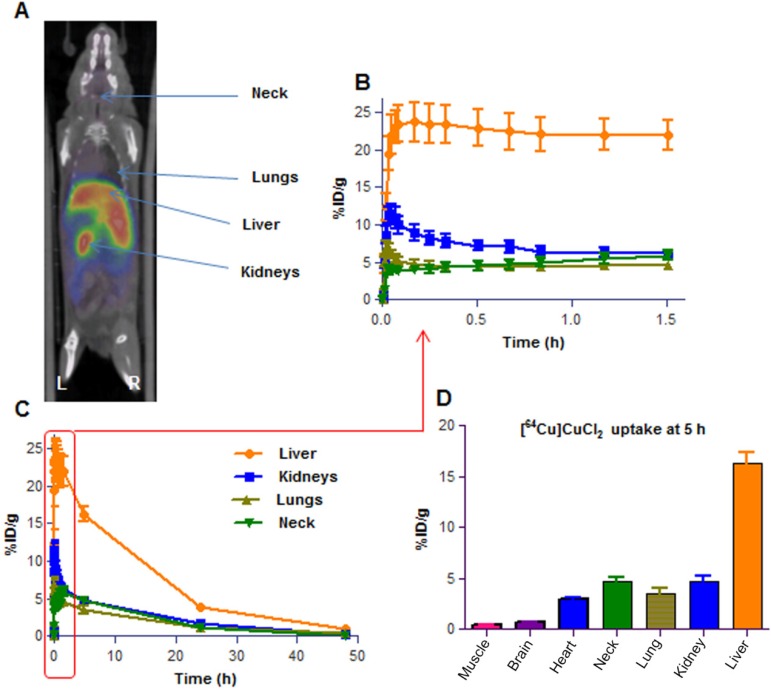
Figure 4.
Representative image of 3D PET/CT image. Balb/c healthy mouse (A); Time activity curve (TAC) of the first 90min dynamic scan (B) and for up to 48 h period (C); Biodistribution of [64Cu]CuCl2 in major organs at 5h time point reported for 7 reference organs (D). Data obtained are presented as mean of n=4 mice, deviation calculated as SEM. %ID/g = percent of Injected Dose per gram of tissue.

