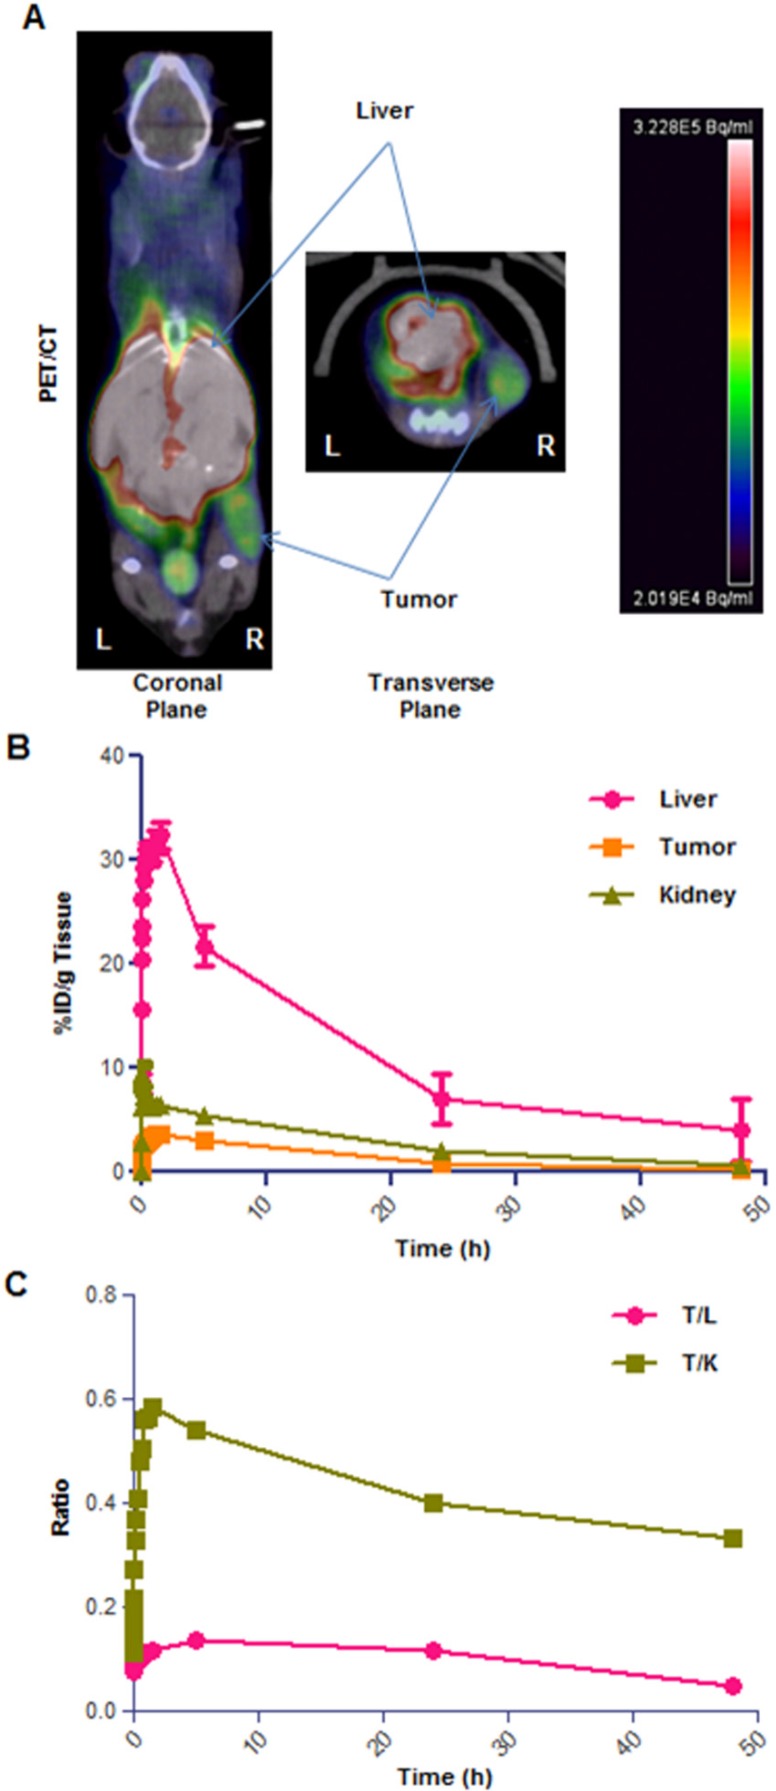
Figure 5.
Representative example of [64Cu]CuCl2 PET/CT on neuroblastoma xenograft (right flank) bearing mice. High-contrast signal confined exclusively to the tumor and liver regions (A); TAC graph showing % ID/g for tumor, kidneys and liver tissues (B); plot of tumor/liver (T/L) and tumor/kidney (T/K) uptake ratio over time (C). Data obtained as mean of n=4 animals per group, deviation calculated as SEM.

