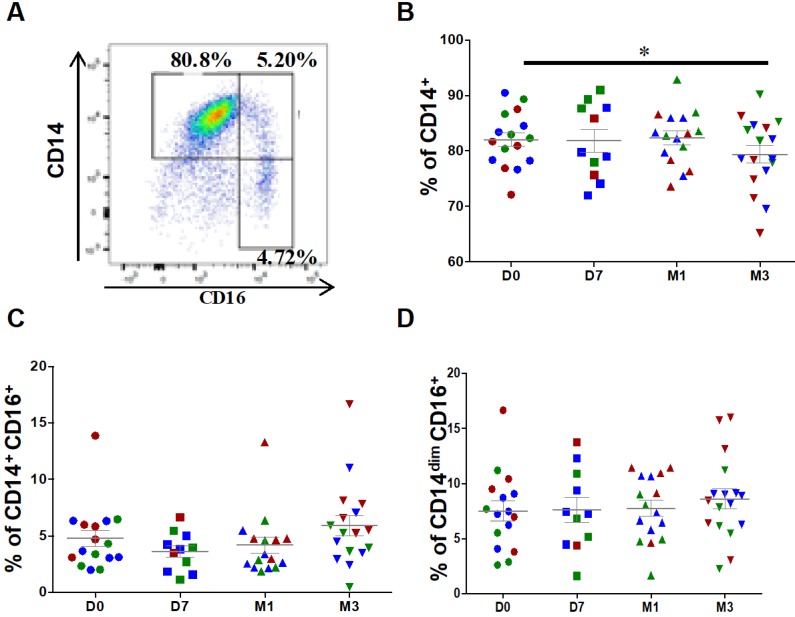
Figure 2.
Changes in the percentages of classical and intermediate monocytes after injection of ASCs. (A) Representative image of a dot plot to identify the three monocytes subsets with the corresponding percentage. Quantification of CD14+ classical monocytes (B), CD14+CD16+ intermediate monocytes (C), and CD14dimCD16+ patrolling monocytes (D) at day 0 (D0, circles), day 7 (D7, squares), 1 month (M1, triangles) and 3 months (M3, inverted triangles) after injection of different amounts of ASCs (red = 2x10⁶ cells, green= 10x106 cells, blue 50x106 cells) in individual patients with severe OA; *p<0.05.

