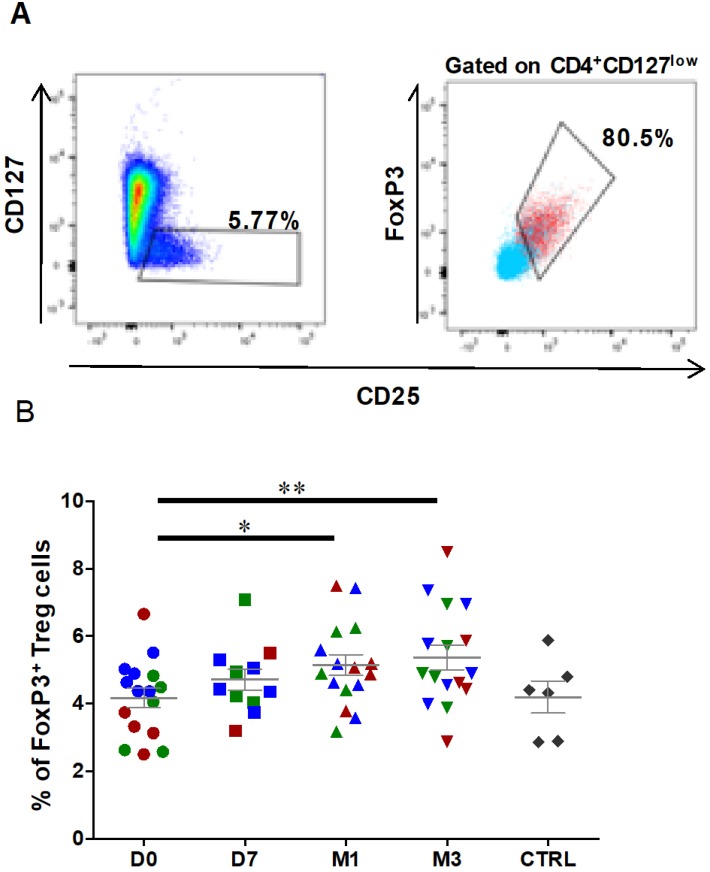
Figure 4.
The percentage of circulating regulatory T cells is increased after ASC injection in the knee. Representative dot plots to identify CD127lowCD25+ cells (left), and CD25+FOXP3+ cells (right) within the CD4+ cell population. Gated CD4+ cells are in blue, and gated CD127lowCD25+ cells in red. (B) Frequencies of Treg cells (CD127lowCD25+ FOXP3+) within the CD4+ population at day 0 (D0, circles), day 7 (D7, squares), 1 month (M1, triangles) and 3 months (M3, inverted triangles) after injection of different amounts of ASCs (red = 2x10⁶ cells, green= 10x106 cells, blue 50x106 cells) in individual patients with severe OA. The percentage of Treg cells in age- and sex-matched healthy controls (CTRL) are represented in grey; *p<0.05 and **p<0.01.

