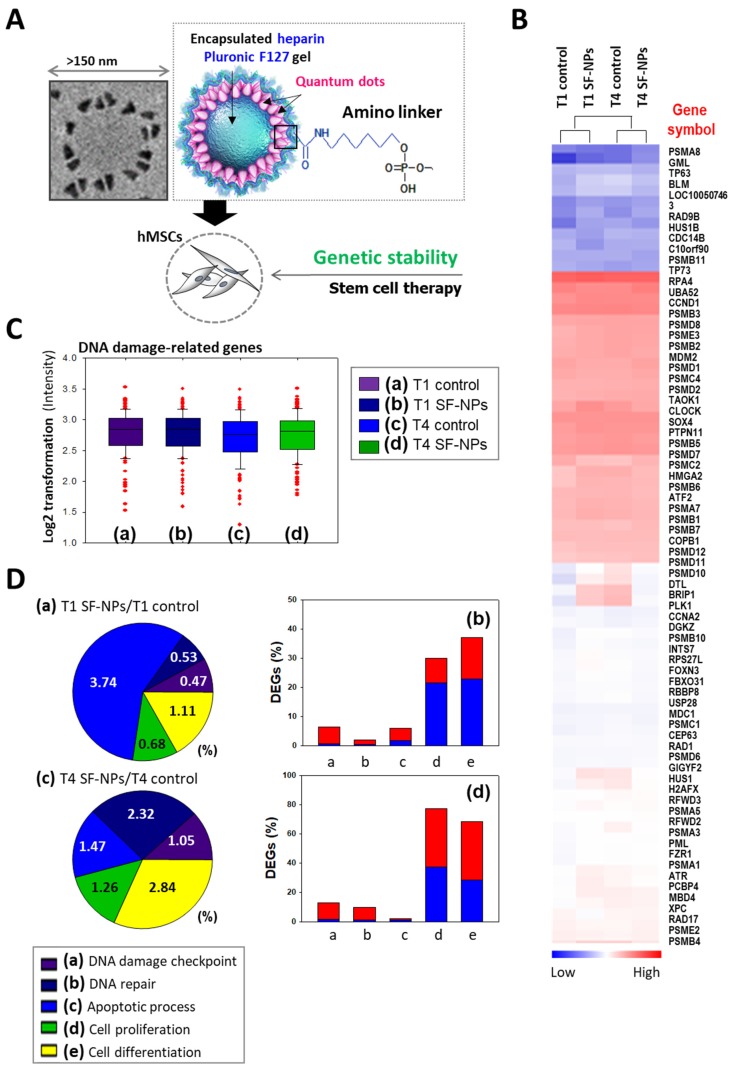
Figure 4.
Microarray analysis of hMSCs transfected with SF-NPs and cultured for 7 days in a 3D system. (A) Schematic illustration of the microarray analysis. (B) Heatmap showing expression levels of genes related to DNA damage in each group of transfected hMSCs, relative to the levels in non-treated hMSCs. (C) Log2 fold changes in expression of DNA damage-related genes. (D) DNA damage-related gene expression in hMSCs, comparing T1 cells vs. T1 cells after transfection with SF-NPs. (a) and (c) Pie charts showing the percentages of differentially expressed genes (DEGs) associated with GO terms “DNA damage checkpoint,” “DNA repair,” “apoptosis process,” “cell proliferation,” and “cell differentiation”; (b) and (d) Bar graphs of the percentages of DEGs that were up- (red) and down-regulated (blue) in each comparison.

