Figure 2.
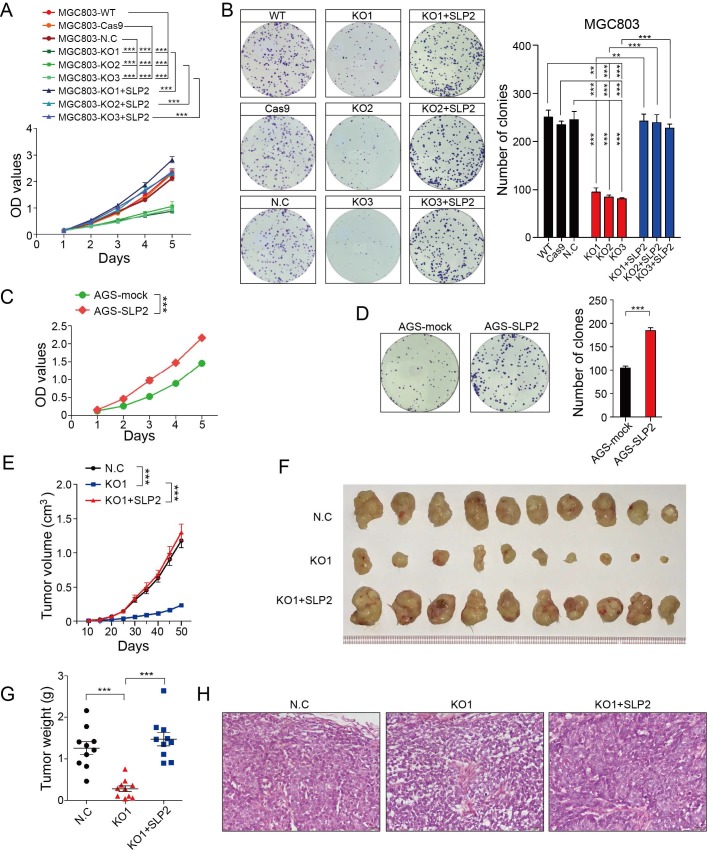
SLP2 promotes proliferation and colony formation rate of GC cell in vitro and tumor growth in vivo. A, proliferation rates of SLP2 knocked-out and restored MGC803 cells measured by CCK8 assay, 5000 indicated cells were plated in 96 culture-plates. MGC803-N.C group were transfected with Cas9 lentivirus and then non-target sgRNA lentivirus. Data are presented as means ± SEM from five independent experiments. The p values were determined using a two-way ANOVA test. ***p < 0.001, B, 500 indicated cells were plated in 6 well culture-plates and the colonies were stained with Giemsa for quantification. Data presented as means ± SEM from three independent experiments. ** p < 0.01, ***p < 0.001, one-way ANOVA test. C, optical density (OD) value of SLP2 overexpressed and mock lentivirus transfected AGS cells measured. 5000 indicated cells were plated in 96 culture-plates. Data presented as means ± SEM from five independent experiments. ***p < 0.001, two-way ANOVA test. D, 500 indicated cells were plated in 6 well culture-plates for colony formation. Data presented as means ± SEM from three independent experiments. ***p < 0.001, unpaired t test. E, 1×10⁶ cell were transplanted into NCG mice (N.C: non-target sgRNA transfected), and tumor growth was monitored after the indicated times. Data are presented as means ± SEM; n = 10 tumors for each group. ***p < 0.001, two-way ANOVA test. F, tumors derived from hind limbs of NCG mice 50 days after subcutaneous injection of indicated cells. G, tumor weight was determined 50 days after transplantation. Data are presented as means ± SEM; n = 10 for each group. p < 0.001, one-way ANOVA test. H, representative H&E staining of primary tumors.

