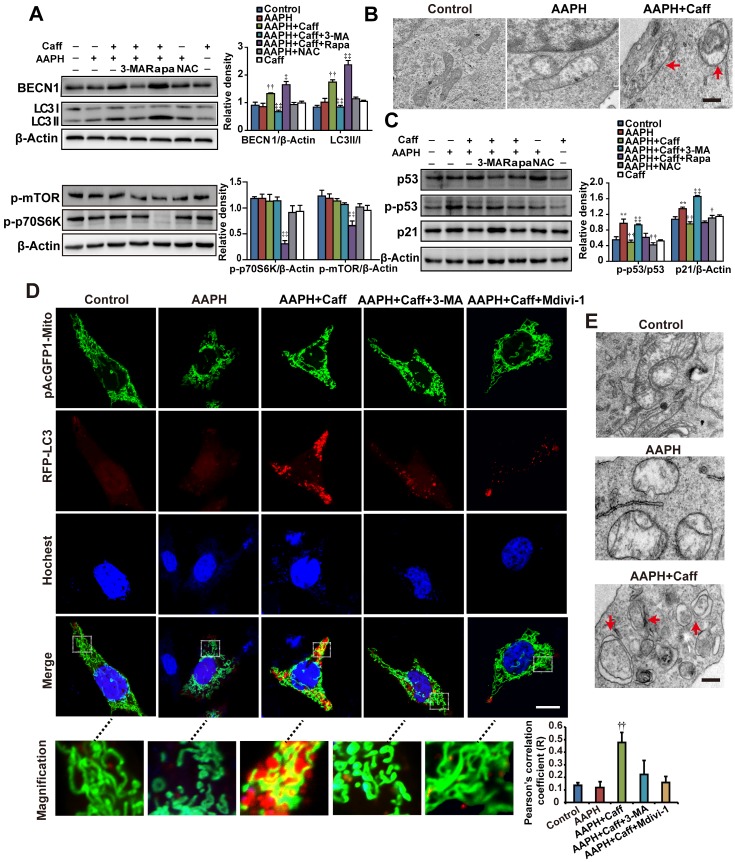
Figure 3.
Caffeine activated autophagy in AAPH-treated cells. (A) Protein expression determined by specific antibodies in A375 cells. Quantitation is shown on the right. (B) Autophagosomes assessed by TEM in A375 cells. Red arrows indicate autophagosomes. Scale bar = 250 nm. (C) Protein expression of p53, p-p53 and p21 determined by western blotting in A375 cells. Quantitation is shown on the Right. (D) Autophagy and mitochondria morphology of NIH3T3 cells monitored under confocal microscopy after co-transfection of RFP-LC3 and pAcGFP1-Mito. Red punctuation: RFP-LC3, Green: pAcGFP1-Mito, Blue: Hochest33258, Yellow: co-localization of RFP-LC3 and pAcGFP1-Mito. Scale bar = 10 μm. Enlarged areas are shown below. The co-localization between the pAcGFP1-Mito green and the RFP-LC3 red signal was analyzed by the Image J software, and the Pearson's correlation efficient is shown (below). (E) Autophagosomes detected by TEM in NIH3T3 cells. Red arrows indicate autophagosomes. Scale bar = 250 nm. AAPH, 1 mM in A375 cells and 2 mM in NIH3T3 cells; Caff (caffeine), 1 μΜ in A375 cells and 10 μΜ in NIH3T3 cells; Rapa (rapamycin), 500 nM; 3-MA, 2 mM; NAC, 1 mM; Mdivi-1, 10 μΜ. Results represent mean ± S.E.M. from three independent experiments. **P < 0.01 vs. Control group, †P < 0.05 and ††P< 0.01 vs. AAPH group, ‡P < 0.05 and ‡‡P< 0.01 vs. “AAPH+Caff” group.

