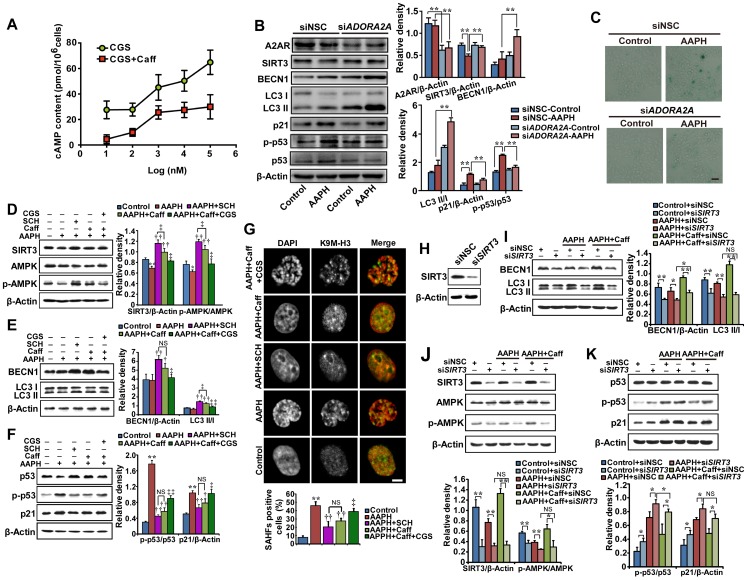
Figure 5.
Caffeine induced autophagy via the A2AR/SIRT3/AMPK pathway. (A) Antagonism of caffeine on A2AR. A375 cells were treated with increasing concentrations of the A2AR agonist CGS21680 with or without 5 μM caffeine for 0.5 h, and cAMP production was measured. (B) Protein expressions of A2AR, SIRT3, AMPK, p-AMPK, LC3, p53, p-p53 and p21 determined by western blotting in cells transfected with control siRNA or siRNA targeting ADORA2A. Quantitation is shown on the right. **P < 0.01 vs. indicated group. (C) Representative images of SA β-Gal positive cells in cells transfected with control siRNA or siRNA targeting ADORA2A. Scale bar = 20 μm. (D-F) Protein expression of SIRT3, AMPK, p-AMPK, BECN1, LC3, p53, p-p53 and p21 determined by western blotting (left) and quantitation (right) is shown. *P < 0.05 and **P < 0.01 vs. Control group, †P < 0.05 and ††P < 0.01 vs. AAPH group, ‡P < 0.05 and ‡‡P < 0.01 vs. “AAPH+Caff” group. (G) Representative images of SAHF visualized under confocal microscopy. Percentage of SAHF-positive cells is shown below. Scale bar = 5 μm. **P < 0.01 vs. Control group, ††P < 0.01 vs. AAPH group, ‡P < 0.05 vs. “AAPH+Caff” group. (H) The effectiveness of SIRT3 siRNA evaluated by western blotting. (I-K) Protein expressions of SIRT3, AMPK, p-AMPK, BECN1, LC3, p53, p-p53 and p21 determined by western blotting in cells transfected with control siRNA or siRNA targeting SIRT3. Quantitative results represent mean ± S.E.M. from three independent experiments. AAPH, 1 mM; Caff (caffeine), 1 μΜ; SCH (SCH58261), 20 nM; CGS (CGS21680), 100 nM. *P < 0.05 and **P < 0.01 vs. indicated group.

