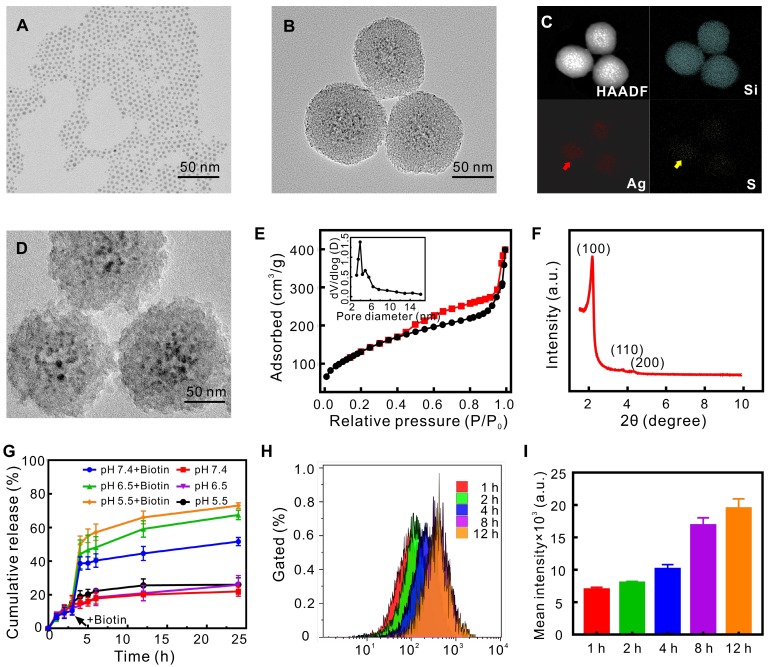
Figure 2.
Characterization of nanoparticles and evaluation of drug controlled release capacity. TEM images of Ag2S QD (A), QD@M (B) and QD@M-DNA/FA (D); high-angle annular dark field image (HAADF), Si, Ag and S elemental mapping images of QD@M (C); nitrogen adsorption-desorption isothermal curve (E) and pore size distribution (inset); small-angle X-ray diffraction of QD@M (F); DOX release curves of QD@M/D-Avidin/FA with and without biotin of different pH (G); intracellular fluorescence intensity (H) and mean intensity (I) were measured by flow cytometry at different time points after QD@M/FITC-Avidin/FA endocytosis in HeLa cells (n=3).

