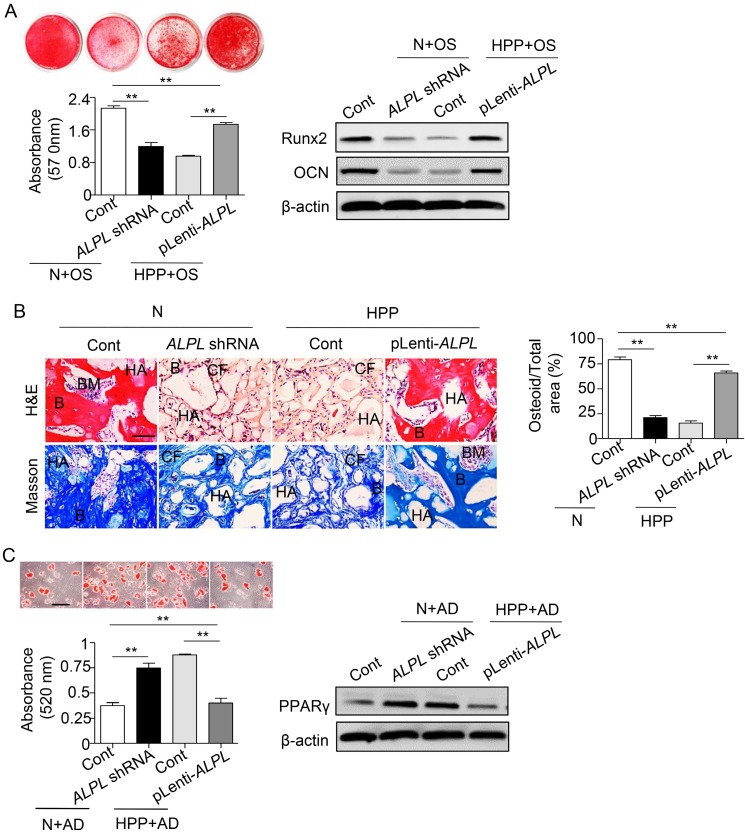
Figure 3.
TNSALP controls the lineage differentiation of BMMSCs. (A) Downregulated ALPL expression in normal BMMSCs and upregulated expression in HPP BMMSCs through lentiviral vectors. Alizarin red staining and quantification of mineralized nodules were performed at day 28 after osteogenic induction (OS). Expression of Runx2 and OCN was examined through western blotting at day 7 after induction. (B) HE/Masson's trichrome staining and quantitative analysis revealed formation of bone (B), bone marrow (BM), and collagen fiber (CF) around HA/TCP (HA) carrier when BMMSCs were implanted into nude mice. Scale bars, 200 μm. (C) Oil Red O staining and quantification of fat depots were performed at day 14 after adipogenic induction (AD). PPAR-γ expression was examined at day 7 after induction by western blotting. Scale bars, 100 μm. Normal control n = 5, HPP n = 2. Data are shown as mean ± s.d. of independent experiments performed in triplicate. *P < 0.05, **P < 0.01. One-way analysis of variance (ANOVA).

