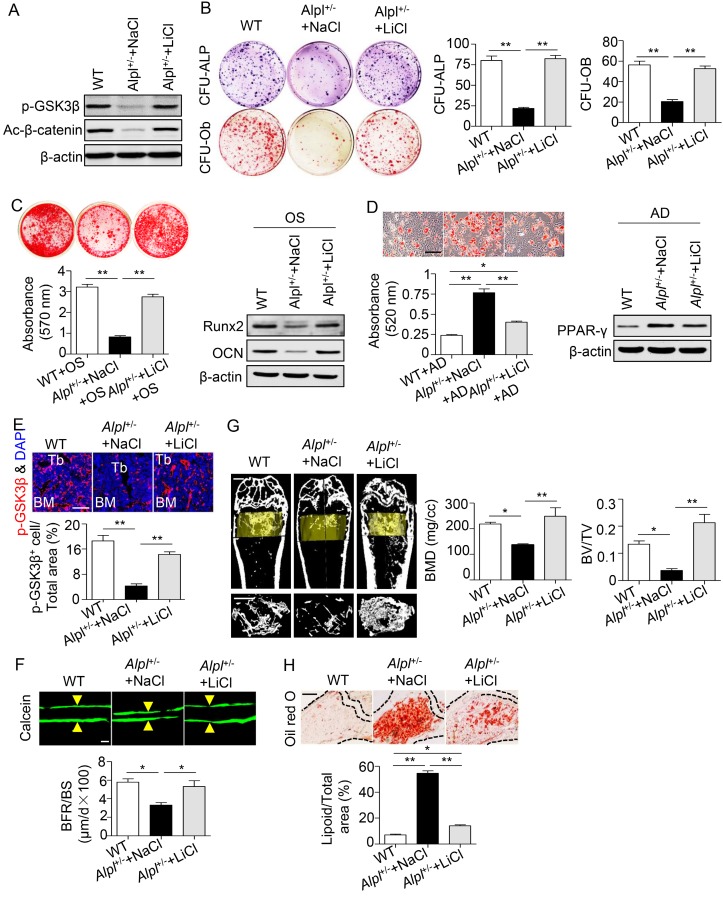
Figure 7.
Recovery of GSK3β phosphorylation rescues impaired BMMSC function and skeletal deformities in Alpl+/- mice. We injected LiCl into the femoral BM cavity of 4-month-old Alpl+/- mice every two weeks at 20 mg/kg for 1 month (total 2 injections) and NaCl was used as a control. (A) Expression levels of p-GSK3β and active-β-catenin in BMMSCs were analyzed by western blotting. (B) CFU-ALP (top panels) and CFU-Ob (bottom panels) assays of harvested mice BMMSCs; quantitative analyses, right panel. (C) Alizarin red staining and quantification of mineralized nodules were performed at day 21 after osteogenic induction in BMMSCs of WT and Alpl+/- mice injected with NaCl and LiCl. Expression levels of Runx2 and OCN were examined by western blotting at day 7 after induction. (D) Oil Red O staining and quantification of fat depots were performed at day 14 after adipogenic induction. Scale bars, 100 μm. PPAR-γ expression was examined by western blotting. (E) Immunostaining analysis of p-GSK3β (red) and nuclear staining (blue, DAPI) of femoral diaphysis. Quantification of GSK3β+ cells is indicated in the bottom panel. Scale bars, 200 μm. (F) Images of calcein double labeling of trabecular (TB) with quantification of BFR/BS. Scale bars, 50 μm. (G) μCT images and quantification of BMD and BV/TV. Scale bars, 1 mm. (H) Oil Red O staining images and quantitative analysis of the area of adipose tissue over the total area of the proximal femoral diaphysis. Scale bars, 500 μm. n = 8 for all groups. All experiments were performed in three independent experiments. The data are presented as mean ± s.d. *P < 0.05, **P < 0.01. One-way analysis of variance (ANOVA).

