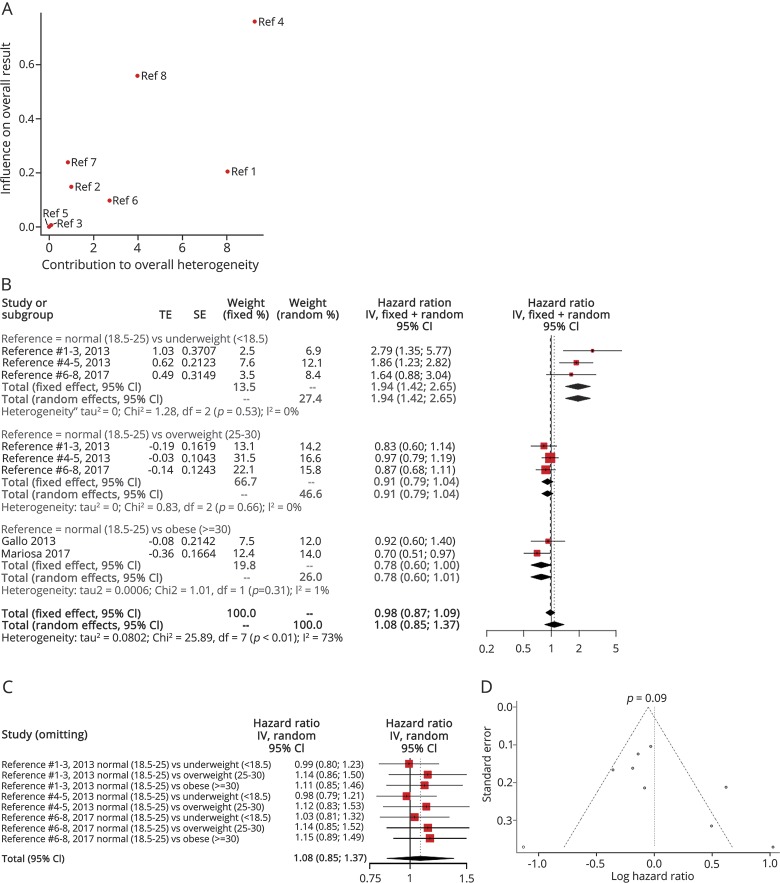
Figure 3. Body mass index (BMI) as a categorical variable.
(A) Baujat plot depicting the influence of each study on the overall result according to the contribution to the overall heterogeneity. Traxinger et al. had the major contribution to the overall heterogeneity and the major influence on the overall result. (1 = “Normal vs Underweight”/Gallo et al.31; 2 = “Normal vs Overweight”/Gallo et al.31; 3 = “Normal vs Obese”/Gallo et al.31; 4 = “Normal vs Underweight”/Traxinger et al.38; 5 = “Normal vs Overweight”/Traxinger et al.38; 6 = “Normal vs Underweight”/Mariosa et al.36; 7 = “Normal vs Overweight”/Mariosa et al.36; 8 = “Normal vs Obese”/Mariosa et al.36) (B) Hazard ratio forest plot of the role of BMI in amyotrophic lateral sclerosis (ALS) survival. The fixed- and random-effects estimates along with their 95% confidence intervals (CIs) are also visualized. BMI is regarded as a continuous variable. (C) Influence analysis according to the leave-one-out method. (D) The funnel plot is indicative of a high risk of publication bias.

