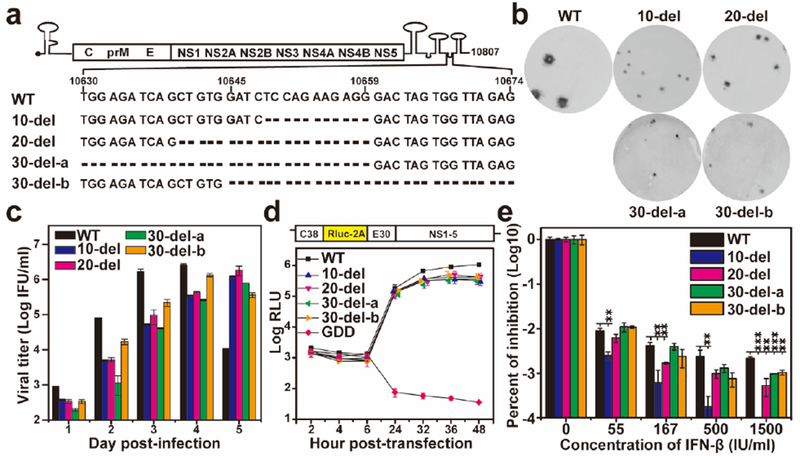
Figure 1. Characterization of the 3’UTR deletion mutants in cell culture.

(a) Sequences of the ZIKV 3’UTR deletions. (b) Immunostaining focus assay of mutant viruses. Equal amounts of RNAs (10 μg) transcribed from their corresponding infectious cDNA clones were electroporated into Vero cells. On day 4 or 5 post-transfection, culture fluids form the transfected cells were harvested and quantified for infectious viruses (defined as P0 virus ) using an immunostaining focus assay on Vero cells. (c) Replication kinetics of WT and mutant viruses. Vero cells in 24-well plates (2×10⁵ cells per well) were infected with WT and mutant viruses at an MOI of 0.01. Culture fluids were quantified for infectious viruses on days 1 to 5 using the immunostaining focus assay. (d) Replicon analysis of the 3’UTR deletions. A Renilla luciferase reporter replicon of ZIKV (top panel) was engineered with various 3’UTR deletions. Equal amounts of replicon WT and mutant RNAs (10 μg) were electroporated into Vero cells. Luciferase signals were measured at the indicated time points (bottom panel). A non-replicative replicon containing an NS5 polymerase-inactive GDD mutation was included as a negative control. The averages of three replicates are presented. Error bars represent standard deviations. RLU, relative light units. (e) Interferon-β inhibition of WT and mutant ZIKVs. Vero cells were seeded in 96-well plate (1.5×10⁴ cell per well) one day before interferon treatment and viral infection. The cells were infected at an MOI 0.05 in the presence of IFN-β (55, 167, 500, or 1,500 IU/ml). Viral infection and interferon treatment were initiated at the same time. At 48 h post-infection and interferon-β treatment, viral titers were quantified using the immunostaining focus assay on Vero cells. Percentages of viral titer inhibition are presented in log10 scale. Viral titers without interferon-β treatment are set as 100%. Average results of three independent experiments are shown. Error bars represent standard deviations. Symbols ** and *** indicate P values <0.01 and <0.001, respectively.
