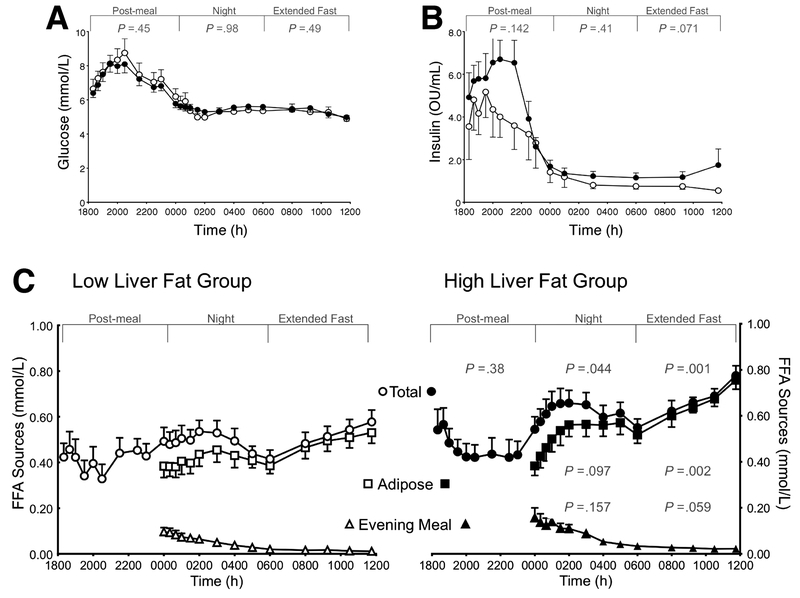
Figure 1. Dynamics of plasma glucose, insulin, and fatty acids.
Data are presented as mean ± SEM. The 18h study period was divided into three segments for analysis: 1800 to midnight (post-evening meal), midnight to 0600 (at night), and 0600 to 1200 (during the extended fast). Panels A displays glucose and (B) insulin concentrations, which were not different between the groups during any of the segments. Panel C: postprandial changes in total plasma free fatty acid (FFA) concentrations (total; circles), those derived from adipose lipolysis (adipose; squares) or from evening-meal spillover (evening meal; triangles) in subjects with High liver fat (HighLF, filled symbols) and Low liver fat (LowLF, open symbols). P-values represent significant differences between the HighLF and LowLF groups for the FFA sources within the designated time period (determined by repeated measures ANOVA).

