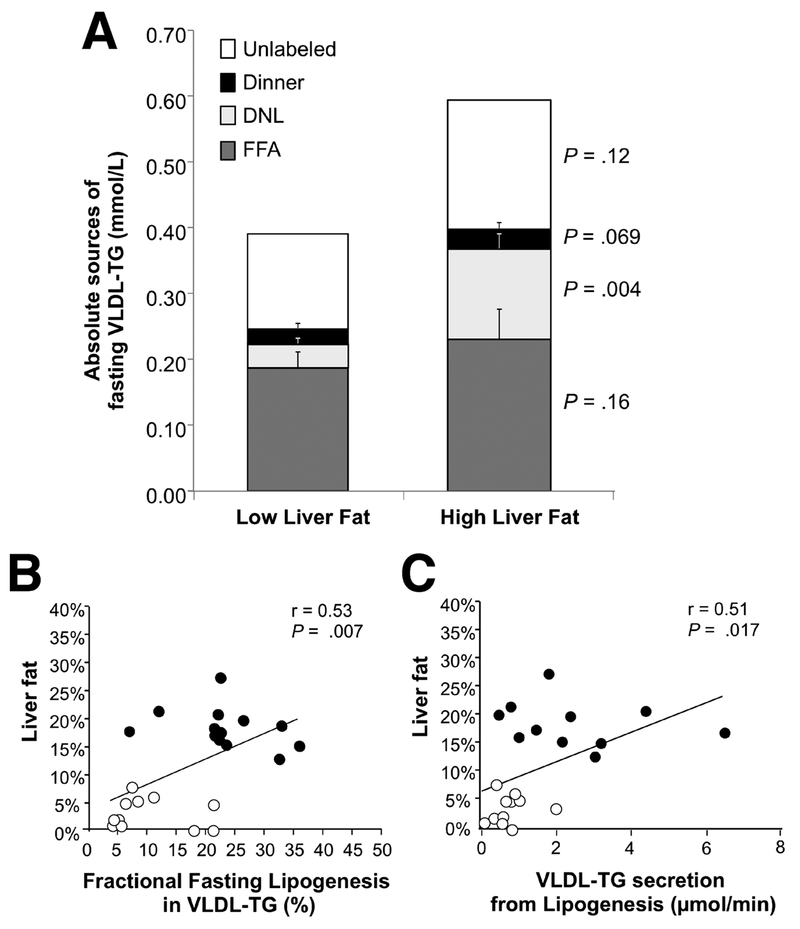
Figure 3. Absolute contributions of fatty acid sources to fasting VLDL-TG in subjects with low or high liver fat and the relationships between liver fat with de novo lipogenesis.
A) The absolute concentrations of fatty acids arising from the evening meal, plasma FFA pool, de novo lipogenesis, and the amount remaining unlabeled in fasting VLDL-TG particles. Values represent the mean group data from each subject in which the last two measurements were taken in the fasting state (e.g., 1030 and 1145) and data from these two time points were averaged for that subject. Relationships between liver fat content and de novo lipogenesis represented as B) newly-synthesized fatty acid in VLDL-TG in units of mmol/L and C) as a fraction of VLDL-TG from lipogenesis (%). Open circles, Low liver fat (LF) group; filled circles, High liver fat (LF) group.

