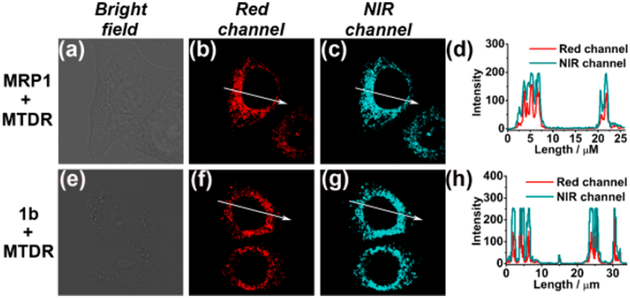
Figure 2.
Confocal image of HepG2 cells costained with either MRP1 and MTDR or 1b and MTDR. (a−c) Bright field, red (λem = 575−650 nm), and NIR (λem = 660−740 nm) images of HepG2 cells costained with MRP1 and MTDR. (d) Intensity profile of regions of interest (ROIs) in the costained HepG2 cells as indicated by the white arrows in (b) and (c). (e−g) Bright field, red, and NIR images of HepG2 cells costained with 1b and MTDR. (h) Intensity profile of the ROIs indicated in (f) and (g).

