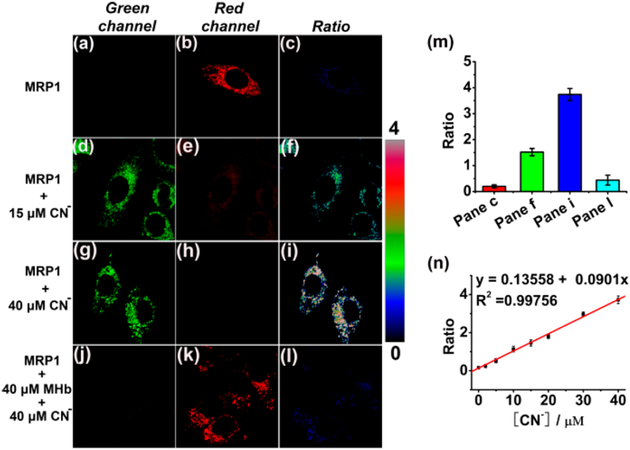
Figure 4.
Confocal images of live HepG2 cells stained with MRP1 (0.5 μM) in the presence of different concentrations of exogenous cyanide. (a−c) Images recorded over the green (λem = 460−530 nm) and red (λem = 575−650 nm) channels, and the corresponding (Fgreen/Fred) ratio for HepG2 cells stained with MRP1 cells and incubated with 0 μM cyanide. (d−f) Green and red channel and ratiometric imaging of HepG2 cells stained with MRP1 and incubated with 15 μM cyanide. (g−i) Green and red channels and ratiometric imaging of MRP1 stained HepG2 cells incubated with 40 μM cyanide. (j−l) Green and red channels and ratiometric imaging of MRP1 stained HepG2 cells pretreated with 40 μM MHb, and then incubated with 40 μM cyanide. (m) Average intensity ratios from images (c), (f), (i), and (l). (n) Linear relationship between the average intensity ratio and cyanide concentration. Error bars represent the standard deviation.

