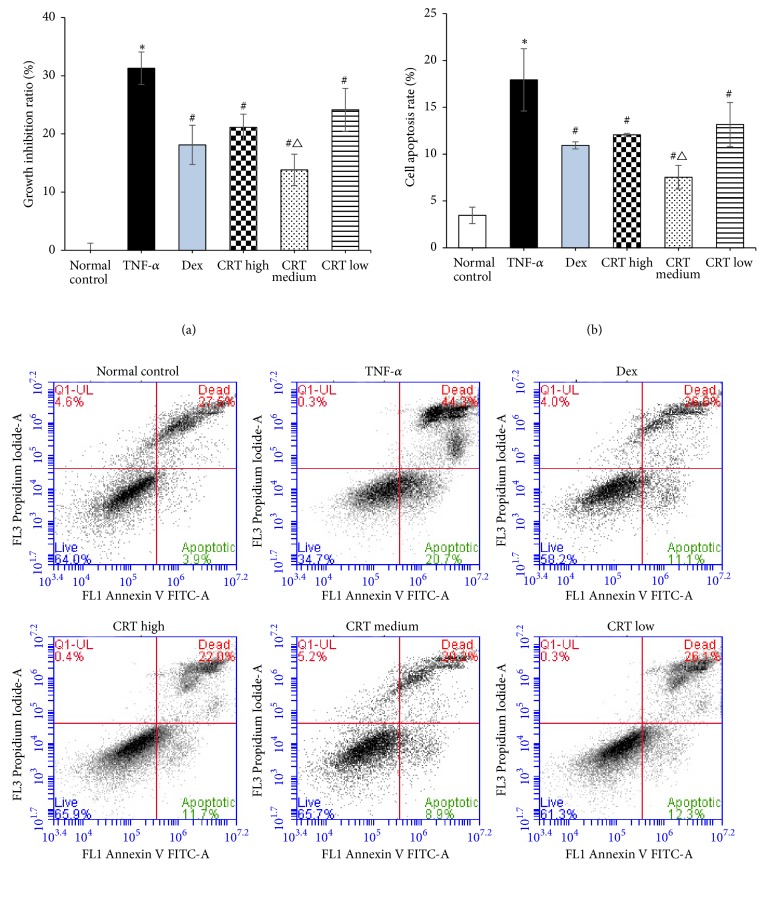
Figure 2.
CRT treatment inhibited the cell proliferation inhibition rate and apoptosis rate induced by TNF- α. Rat PMEC monolayers were divided into 6 groups: normal control, TNF-α, Dex, CRT high, CRT medium, and CRT low groups. After 48 h incubation, cell proliferation (a) and apoptosis (b) were detected by MTT assay and flow cytometry, respectively. The cell proliferation inhibition rate (%) = (OD value in control group - OD value in experimental group)/OD value in control group × 100%. ∗, P<0.05, TNF-α group vs. normal control group; #, P<0.05 treatment groups vs. TNF-a group; △, P<0.05, CRT groups vs. Dex group.

